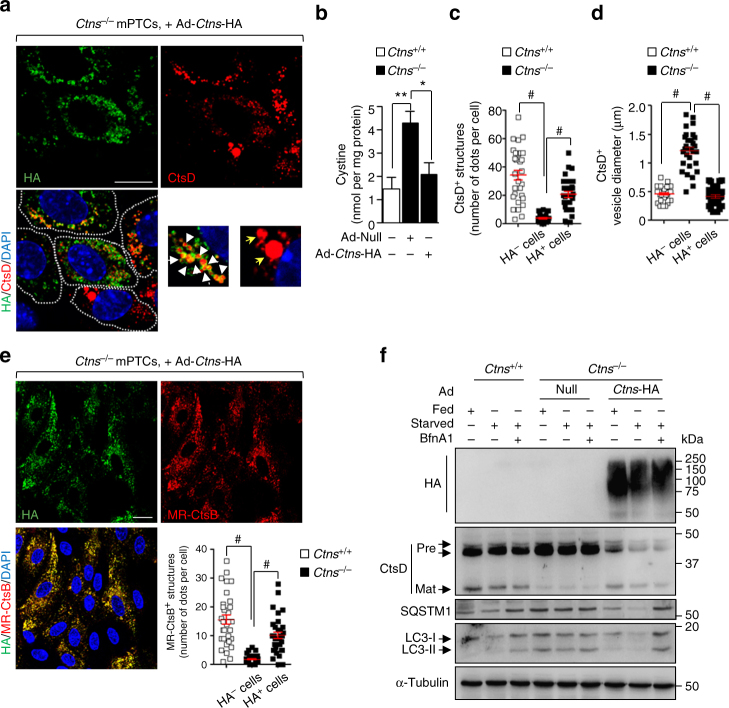
Fig. 4.
Rescue of lysosome–autophagy pathway by re-expressing CTNS in Ctns−/− cells. a–f Ctns−/− mPTCs were transduced with either Null (Ad-Null) or hemagglutinin-tagged Ctns (Ad-Ctns-HA) bearing adenoviral particles for 2 days. a Cells were immunostained with anti-HA (green) and anti-CtsD (red) antibodies, and analysed by confocal microscopy. Insets: high magnification of Ctns-HA+ vesicles containing CtsD. b Intracellular cystine levels were measured by HPLC. Two-tailed unpaired Student’s t-test, **P < 0.01 relative to Ctns+/+ mPTCs; *P < 0.05 relative to Ctns−/− mPTCs transduced with Ad-Null. c Quantification of changes in the number of CtsD+ and d in the average vesicle size in cells from a (n = 30 cells pooled from three Ctns kidneys per condition; each point representing the number or the average size of CtsD+ vesicles in a cell; one-way ANOVA followed by Bonferroni’s post hoc test, #P < 0.0001 relative to Ctns+/+ mPTCs or to HA− Ctns−/− mPTCs. e Ctns mPTCs were loaded with MR-CtsB peptide (1 μM, for 1 h at 37 °C) and immunostained with anti-HA antibody. Quantification of numbers of MR-CtsB+ structures (n = 33 cells pooled from three Ctns kidneys per condition, each point representing the number of MR-CtsB+ vesicles in a cell; one-way ANOVA followed by Bonferroni post hoc test, #P < 0.0001 relative to Ctns+/+ mPTCs or to HA− Ctns−/− mPTCs). f Ctns mPTCs were cultured in fed or starved medium in presence or in absence of 250 nM BfnA1 for 4 h. The cells were lysed and subjected to western blotting analysis for the protein levels of HA, CtsD, SQSTM1, and LC3. α-Tubulin was used as a loading control, n = 3 independent experiments. Plotted data represent mean ± SEM. The nuclei are counterstained with DAPI (blue). Yellow indicates colocalization. Scale bars are 10 μm

