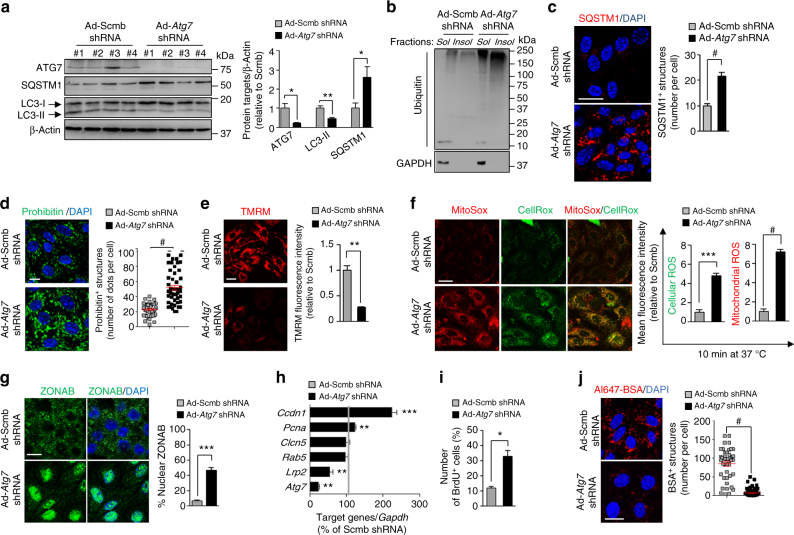
Fig. 5.
Failure of autophagy causes proliferation and dedifferentiation of PT cells. a–j mPTCs were transduced with either scrambled (Scmb) or Atg7 adenoviral shRNAs for 5 days. a Western blotting and densitometric analyses of ATG7, SQSTM1, and LC3 levels. β-Actin was used as a loading control, n = 4 independent experiments. b Representative western blotting of the soluble and insoluble fractions derived from mPTCs and immunoblotted for ubiquitin and GAPDH; n = 3 independent experiments. c Confocal analysis of SQSTM1+ structures (red) in mPTCs (n = 143 cells pooled from four Ctns kidneys per condition) and d of prohibitin+ structures (green) in mPTCs (n = 40–50 cells pooled from three mouse kidneys per condition). e The cells were loaded with tetramethylrhodamine methyl ester (TMRM; mitochondrial membrane potential fluorescent probe, 50 nM for 30 min at 37 °C) and analysed by confocal microscopy. Quantification of TMRM fluorescence intensity obtained from five randomly selected fields per condition, with each containing ~ 20–25 cells. f mPTCs were loaded with CellROX (green, cellular ROS probe; 5 µM for 10 min at 37 °C) and Mito SOX (red, mitochondrial ROS probe; 2.5 µM for 10 min at 37 °C) analysed by confocal microscopy. Quantification of CellROX or MitoSOX fluorescence intensity obtained from three randomly selected fields per condition, with each containing ~ 20–25 cells. g mPTCs were immunostained with anti-ZONAB (green) antibody and analysed by confocal microscopy. Quantification of ZONAB+ nuclei (in percentage of the total nuclei) obtained from five randomly selected fields per condition, with each containing ~ 20–25 cells. h The mRNA levels of Atg7, Clcn5, Rab5, Lrp2, Ccdn1, and Pcna were analysed by real-time PCR (n = 4 independent experiments). i mPTCs were loaded with bromodeoxyuridine (BrdU, 1.5 μg ml−1 for 16 h at 37 °C), immunostained with anti-BrdU antibody and analysed by confocal microscopy. Quantification of numbers of BrdU+ cells (in percentage of total nuclei) obtained from five randomly selected fields per condition, with each containing ~ 20–25 cells. j The cells were loaded with Al647-BSA (50 μg ml−1 for 15 min at 37 °C) and imaged by confocal microscopy. Quantification of numbers of Al647-BSA+ structures (n = 49–85 cells pooled from three mouse kidneys per condition; each point representing the number of BSA+ structures in a cell). Plotted data represent mean ± SEM. Two-tailed paired Student’s t-test, *P < 0.05, **P < 0.01, ***P < 0.001, and #P < 0.0001 relative to mPTCs transduced with Scmb shRNAs; NS, not significant. Nuclei are counterstained with DAPI (blue). Scale bars are 10 μm

