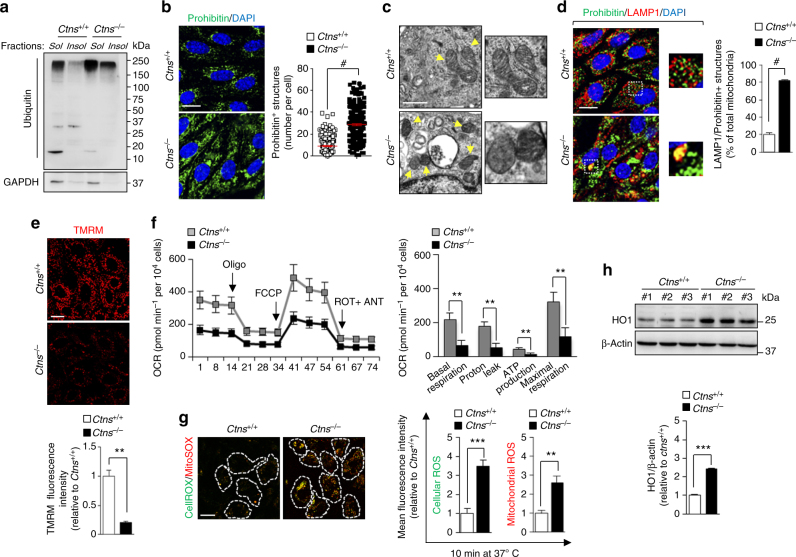
Fig. 6.
Accumulation of dysfunctional ROS-producing mitochondria in Ctns−/− cells. a Representative western blotting of the soluble and insoluble fractions derived from Ctns mPTCs were immunoblotted for ubiquitin and GAPDH, n = 3 independent experiments. b Confocal analysis of prohibitin+ structures (green) in Ctns mPTCs (n = 240–280 cells pooled from three mouse kidneys per condition; each point representing the number of prohibitin+ structures in a cell). c Representative electron micrographs of mitochondria in Ctns mPTCs. Insets: mitochondria at higher magnification. d Ctns mPTCs were immunostained with anti-prohibitin (green) and anti-LAMP1 (red), and the numbers of LAMP1/prohibitin+ structures were quantified by confocal microscopy (percentage of total lysosomes; n = 5 randomly selected fields per condition, each containing ~ 20–25 cells). e Ctns mPTCs were loaded with tetramethylrhodamine methyl ester (TMRM; mitochondrial membrane potential fluorescent probe, 50 nM for 30 min at 37 °C) and analysed by confocal microscopy. Quantification of TMRM fluorescence intensity obtained from five randomly selected fields per condition, with each containing ~ 20–25 cells. f Oxygen consumption rate (OCR) and individual parameters for basal respiration, ATP production, proton leak, and maximal respiration. Oxygen consumption rates (OCRs) were measured under basal level and after the sequential addition of oligomycin (Oligo, 1 μM), FCCP (0.5 μM), and Rotenone (ROT; 1 μM) + Antimycin A (ANT; 1 μM); n = 3 independent experiments. g Ctns mPTCs were loaded with CellROX (cellular ROS probe; 5 μM for 10 min at 37 °C) and MitoSOX (mitochondrial ROS probe; 2.5 μM for 10 min at 37 °C) and analysed by live confocal microscopy. Quantification of CellROX or MitoSOX fluorescence intensity was obtained from five randomly selected fields per condition, with each containing ~ 20–25 cells. h Western blotting and densitometric analyses of HO1 levels. β-Actin was used as a loading control, n = 3 independent experiments. Plotted data are mean ± SEM. Two-tailed unpaired Student’s t-test **P < 0.01, ***P < 0.001, and #p < 0.0001 relative to Ctns+/+ mPTCs. Nuclei are counterstained with DAPI (blue). Scale bars are 10 μm in b, d, e, and g; 1 μm in c

