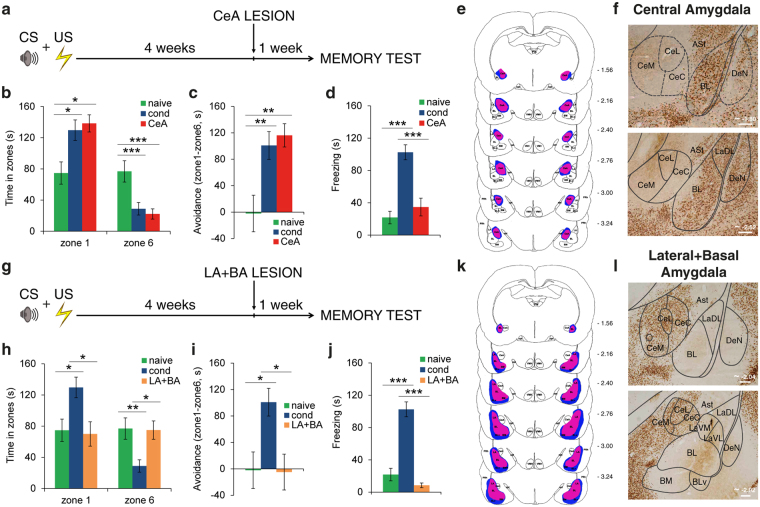
Figure 4.
Long-term expression of fearful memories in animals with CeA or LA + BA lesions. (a) Rats were lesioned in the CeA four weeks after training. (b) Time spent in zone 1 and zone 6 by naive, conditioned and CeA-lesioned rats (n = 9). CeA-lesioned animals differed from naive animals in zone 1 and in zone 6, whereas there were no differences between CeA-lesioned and conditioned rats. (c) CeA-lesioned rats showed significant CS avoidance, similarly to conditioned animals. (d) Freezing behavior in CeA-lesioned rats was lower than in the conditioned group and similar to that in naive animals. (e) Reconstructions of the narrowest (red-violet) and the largest (blue) excitotoxic lesion of the CeA. Negative numbers indicate posterior distance from bregma. The serial section diagram was drawn on the basis of our NeuN-stained sections. (f) Representative photomicrographs of NeuN-staining of CeA damage. Scale bars, 200 μm. (g) Rats received combined lesions of LA + BA four weeks after training. (h) Time spent in zone 1 and zone 6 during the memory test, by naive, conditioned and LA + BA-lesioned rats (n = 8). A mixed ANOVA revealed a significant main effect of the zone (F(1,33) = 4.27, P = 0.047), significant main effects of the group in zone 1 (F(2,33) = 5.68, P = 0.008) and in zone 6 (F(2,33) = 6.40, P = 0.004). Rats that underwent a lesion in the LA + BA spent less time in zone 1 (P = 0.030) and more time in zone 6 (P = 0.033) than conditioned subjects, but did not differ from naive rats (P > 0.05 in both instances). (i) Similarly to naive subjects, avoidance behavior (F(2,33) = 6.17, P = 0.005) was lower in LA + BA lesioned rats relative to conditioned ones (P = 0.028). (j) Freezing responses in animals lesioned in the LA + BA (F(2,33) = 38.7, P < 0.001) were lower than conditioned ones (P < 0.001) but similar to naive ones (P > 0.05). (k) Reconstructions of the extension of LA + BA lesions. Smallest damage is red-violet painted, largest is blue painted. The serial section diagram was drawn on the basis of our NeuN-stained sections. (l) Representative photomicrographs of NeuN-staining of the LA + BA lesion. Scale bars, 500 μm. *P < 0.05; **P < 0.01; ***P < 0.005. All values are reported as the mean ± SEM. ASt, amygdalostriatal transition; BL, basolateral amygdaloid nucleus; BLv, basolateral amygdaloid nucleus, ventral part; BM, basomedial amygdaloid nucleus; cc, corpus callosum; CeA, central amygdaloid nucleus; CeC, central amygdaloid nucleus, capsular division; CeL, central amygdaloid nucleus, lateral division; CeM, central amygdaloid nucleus, medial division; DeN, dorsal endopiriform nucleus; LA, lateral amygdaloid nucleus; LaDL, lateral amygdaloid nucleus, dorsolateral part; LaVL, lateral amygdaloid nucleus, ventrolateral part; LaVM, lateral amygdaloid nucleus, ventromedial part; opt, optic tract; PRh, perirhinal cortex; PVA, paraventricular thalamic nucleus, anterior part; VMH, ventromedial hypothalamic nucleus. See also Supplementary Fig. S3.

