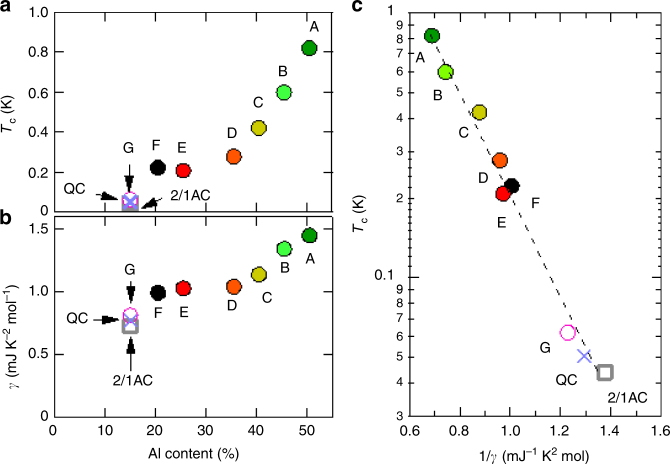
Fig. 6.
Relation between transition temperature and coefficient. a Superconducting transition temperature as a function of Al content. Note that shows the sharp drop at Al content of about 15% corresponding to the QC and the 2/1AC. b Electronicspecific heat coefficient as a function of Al content. The slight drop at 15% Al content suggests the pseudogap formation. c Correlation between and . The straight line denotes the interrelationship, , marking the constant pairing interaction

