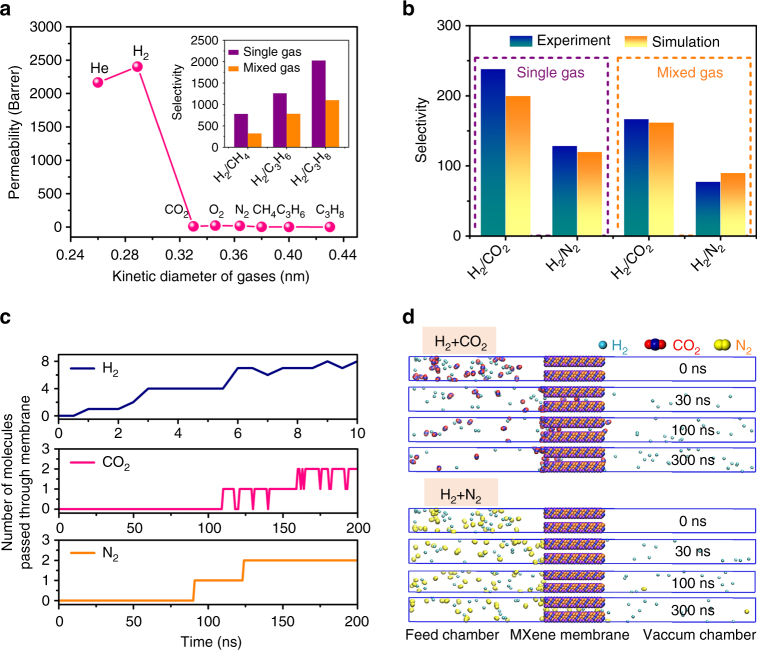
Fig. 2.
MD simulations of the gas permeation through the MXene membrane compared with the experimental results. a Single-gas permeabilities through a 2-μm-thick MXene membrane as a function of the gas kinetic diameter at 25 °C and 1 bar. Inset shows the selectivity of H2 relative to the other gases in both the single-gas and equimolar mixed-gas permeation studies. b Comparison of the experimental and MD simulated selectivities of H2/CO2 and H2/N2 in both the single-gas and mixed-gas permeations. c The number of gas molecules that passed through the MXene membrane in MD simulation as a function of simulation time for single-gas permeation. For H2, only the first 10 ns of the simulation are shown because of its fast permeation. By contrast, only two molecules pass through the MXene membrane during the 200-ns-long simulation for CO2 or N2. The CO2 curve fluctuates because of CO2 adsorption–desorption on the MXene membrane. d Simulation snapshots at 0, 30, 100, and 300 ns for two sets of mixed-gas permeation systems: (H2 + CO2) and (H2 + N2). Note that H2 was modeled by united-atom force field. The MXene membrane was composed of two nanosheets with a free spacing of 0.35 nm located in the middle of the simulation system. In the beginning (t = 0 ns), 30 H2 and 30 CO2 (or N2) molecules were present in the feed chamber, which permeated through the MXene membrane to the evacuated permeate chamber. The details can be found in section of “Methods”

