. 2017 Dec 27;14(1):90–97. doi: 10.3988/jcn.2018.14.1.90

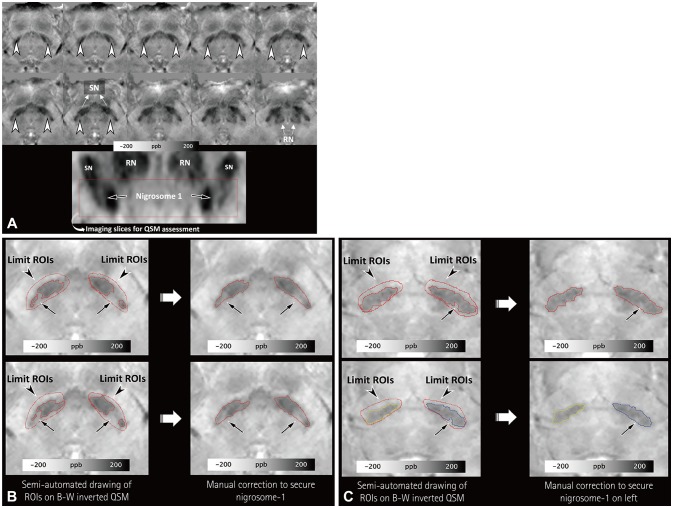
Fig. 1. Semiautomated drawing of ROIs on negative monochrome QSM images. ROIs are first drawn within the SN below the level of the inferior border of the RN on axial oblique QSM images [A, nigrosome-1 regions are hyperintense and indicated by arrowheads on axial oblique QSM images (upper two rows) and are indicated by arrows on the oblique-coronal reformatted image (lower row)]. After delimiting the SN, ROIs are drawn semiautomatically with a threshold of 80–300 ppb. The unselected regions (arrows in B and C) in the dorsolateral aspect of the SN are considered the regions that include intact nigrosome-1, and were manually identified at two different image levels below the RN in both healthy subjects (B) and earlystage idiopathic Parkinson's disease patients (C). QSM: quantitative susceptibility mapping, RN: red nucleus, ROI: region of interest, SN: substantia nigra.

Fig. 1