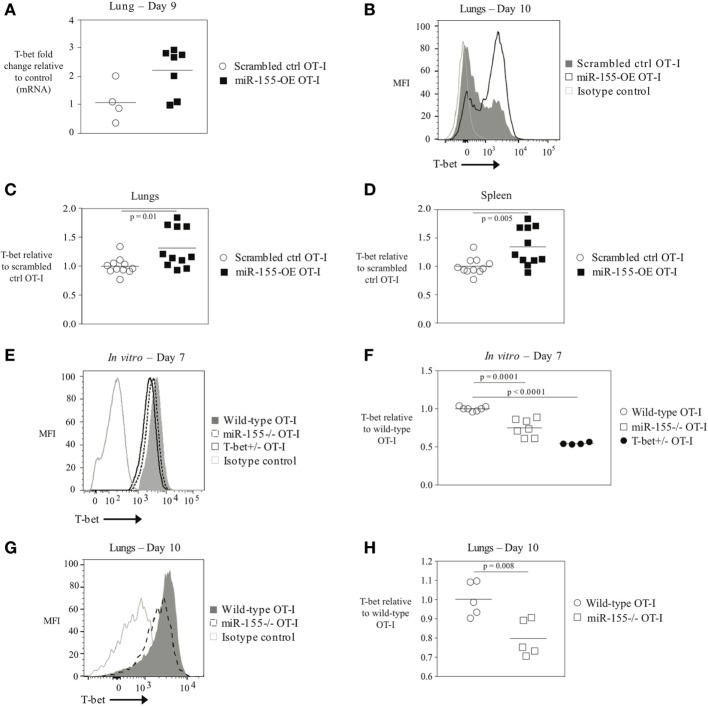
Figure 3.
The transcription factor T-bet upregulated in miR-155-overexpressing anti-viral CD8+ T cells. (A) RT-PCR analysis of T-bet expression in donor OT-I cells sorted from lungs of WSN-OVA influenza virus-infected mice 9 days post-infection; results were normalized to GAPDH RNA expression and are presented relative to scrambled ctrl OT-I levels. Each dot represents an individual mouse, n = 4–7 mice per group from two independent experiments. Data are not normally distributed (Shapiro–Wilk) and significance was assessed using an unpaired Mann–Whitney exact test. (B) T-bet intracellular flow cytometry of donor cells from lungs of wild-type mice that received scrambled ctrl OT-I or miR-155-OE OT-I cells and assessed at day 10 after infection with influenza virus. Histogram of T-bet expression in donor OT-I cells shown is representative of at least three independent experiments. (C) Dot plot of T-bet expression in miR-155-OE OT-I cells relative to scrambled ctrl OT-I expression in donor cells from lungs of influenza virus-infected animals 9–10 days post-infection. Data are not normally distributed (D’Agostino-Pearson) and significance was assessed using an unpaired Mann–Whitney exact test. (D) Dot plot of T-bet expression in miR-155-OE OT-I cells relative to scrambled ctrl OT-I expression in donor cells in the spleen of influenza virus-infected animals 9–10 days post-infection. Data are normally distributed (D’Agostino-Pearson) and significance was assessed using an unpaired t-test. (E) Representative intracellular T-bet flow cytometry of OT-I, miR-155−/− OT-I, or T-bet+/− OT-I cells activated for 7 days in vitro. (F) T-bet MFI levels in in vitro activated OT-I, miR-155−/− OT-I, or T-bet+/− OT-I cells relative to OT-I control cells. Each dot represents an individual mouse, n = 4–7 mice per group from three independent experiments. Data are normally distributed (Shapiro–Wilk) and significance was assessed using an unpaired t-test. (G) Representative histogram and (H) dot plots of T-bet expression in donor OT-I and miR-155−/− OT-I cells in the lungs of wild-type mice 10 days after infection with influenza virus. Data from two independent experiments, n = 5 animals per group. Data are normally distributed (Shapiro–Wilk) and significance was assessed using an unpaired t-test.

