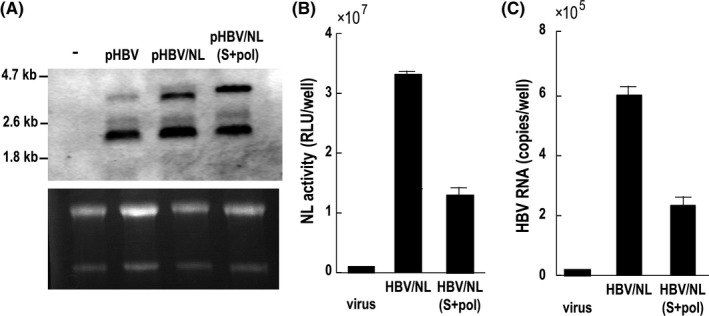
Figure 6.

Comparative analysis of virus RNA in transfected cells and the amount of viruses produced from those cells. (A) Six days after transfection, 30 μg RNA from wild pHBV, pHBV/NL and pHBV/NL(S+pol)‐transfected cells was analyzed by northern blot using digoxigenin (DIG) HBV RNA probes covering the full‐length HBV genome. The gel was stained with ethidium bromide to visualize ribosomal RNA. The efficiency of transfection was similar (data not shown). (B,C) Six days after transfection by wild pHBV, pHBV/NL and pHBV/NL(S+pol), virus fractions from culture medium were harvested. One‐tenth of the volume of culture medium was used to infect HepG2/NTCP#22. NL activity and the amount of virus RNA in cell lysates in (B) and (C), respectively, were measured after 6 days of infection. HBV, hepatitis B virus; NL, NanoLuc
