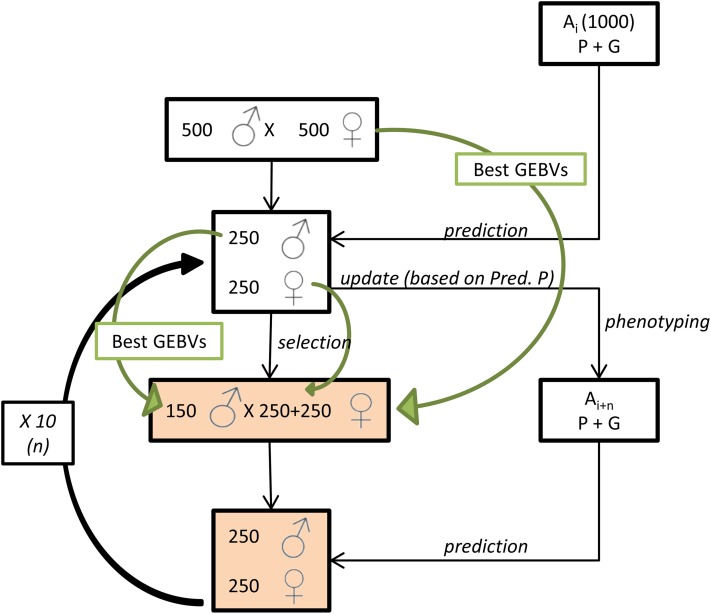
Figure 1.
Simulation design. This figure represents the scheme used for simulations. The highlighted boxes represent the population under consideration. The green arrows inform on the selection decision. G, genotype; GEBV, genomic estimated breeding value; P, phenotype; Pred. P, predicted phenotype.

