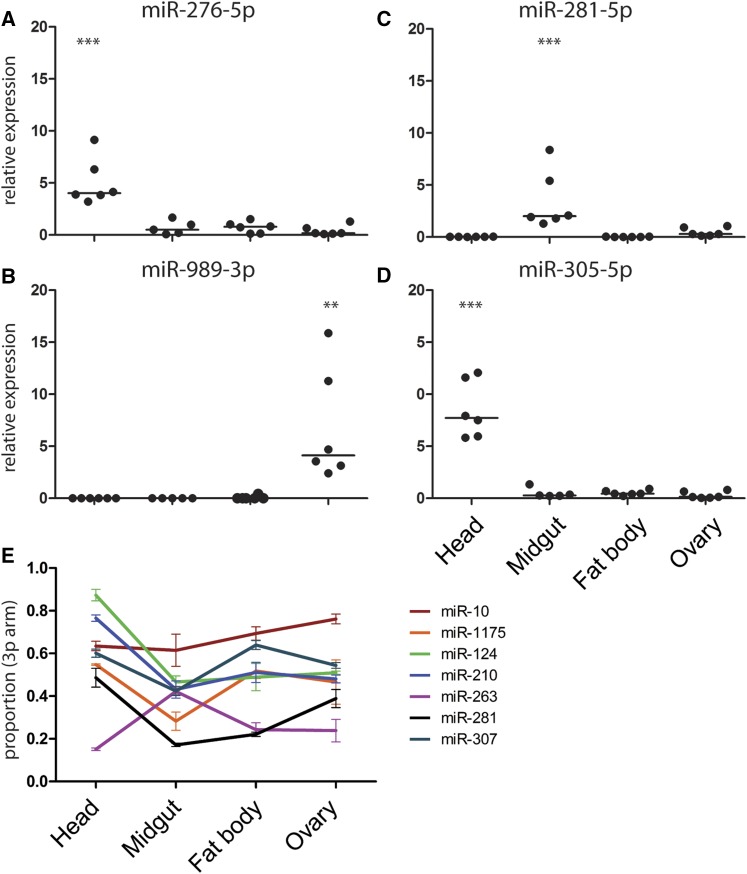
Figure 3.
Tissue-specific expression of microRNAs (miRNAs) quantified by quantitative polymerase chain reaction of (A) miR-276-5p, (B) miR-281-5p, (C) miR-989-3p, and (D) miR-305-5p. miRNA expression values are plotted as dots with the line indicating the mean. miRNA expression levels were normalized using the ribosomal protein RPS7 gene. Results of six independent experiments are shown. ** P < 0.005 and *** P < 0.0005, one-way ANOVA followed by Tukey’s post hoc test. (E) Tissue-specific differences in miRNA 3p-arm proportion. All depicted 3p-arm proportions significantly change between tissues tested by one-way ANOVA (P-value < 0.05; Table S3 in File S1).

