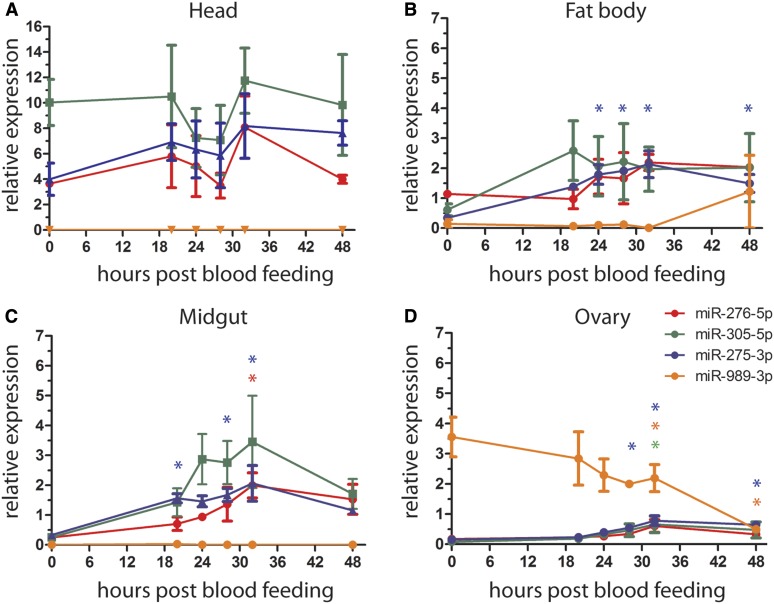
Figure 5.
Tissue-specific expression of miR-276-5p, miR-305-5p, miR-275-3p, and miR-989-3p during the postblood meal phase in (A) the head, (B) the fat body, (C) the midgut, and (D) the ovary. Results of three independent experiments are shown as mean ± SEM. For statistical analyses, all time points were compared to 0 hr (unfed) by one-way ANOVA, Tukey’s post hoc test and significant differences are shown by asterisk (* P < 0.05; n = 5).

