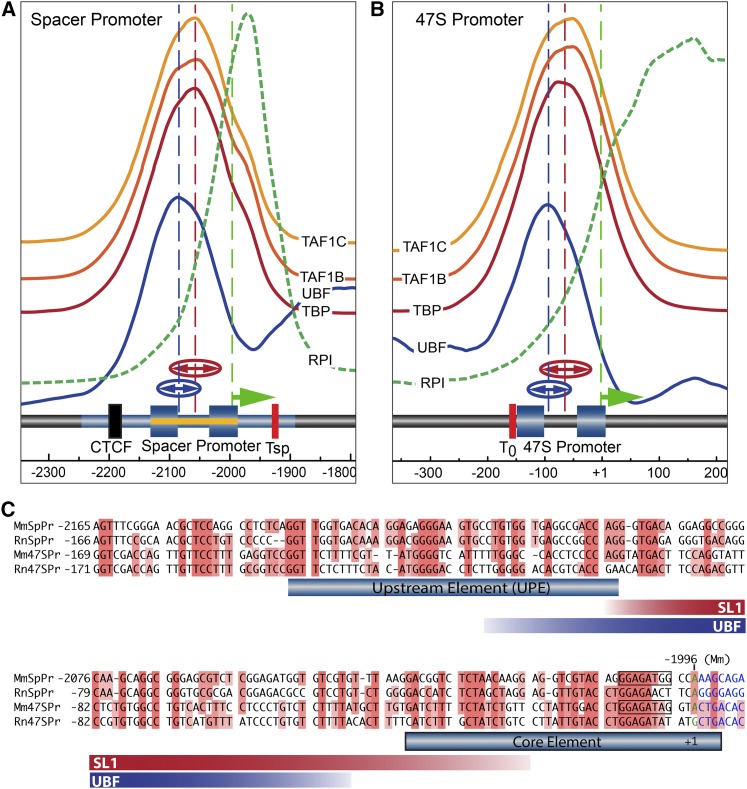
Figure 4.
Mapping of preinitiation complexes at the Spacer and 47S Promoters of MEFs. (A and B) Show the interaction profiles of the TAF1B, -C, and TBP components of SL1, and of UBF and RPI across the Spacer and 47S Promoter regions in MEFs (MTAB-5893). The deconvoluted ChIP mapping profiles are shown stacked above a diagrammatic representation of the underlying rDNA sequence elements. The mapping profiles for each SL1 component (TAF1B, -C, and TBP) are shown on the same vertical scale of enrichment in (A and B), indicating that they are recruited equally efficiently at both promoters. For convenience, the vertical scale of enrichment for RPI at the two promoters is, however, different (see Figure 2B for a quantitative comparison). The extent of the Spacer Promoter was predicted by analogy to the 47S Promoter indicated by the blue-shaded boxes corresponding to the mapped UPE and Core elements. The original identification of the mouse Spacer Promoter and Spacer initiation site at −1996 bp (relative to the 47S initiation site, GenBank BK000964v3) (Kuhn and Grummt 1987), are indicated by blue shading band and an arrow (green). Functional mapping of the Spacer Promoter of rat (Smith et al. 1990), (−143 to +1 bp relative to the initiation site and requiring sequences upstream of −90 bp), is indicated in (A) by a yellow band. The broken vertical blue and red lines in (A and B) indicate the mean centers and “(↔)” the half-height half-widths of best-fit Gaussian distributions to the UBF and SL1-component mapping profiles obtained, respectively, from five to eight independent biological replicas. (C) Alignment of mouse (Mm) and rat (Rn) 47S and Spacer (SpPr) Promoters. The extent of SL1 components and UBF interactions are indicated by red and blue bands showing the mean half-height half-widths of the best-fit Gaussians to the mapping data, as in (A and B).

