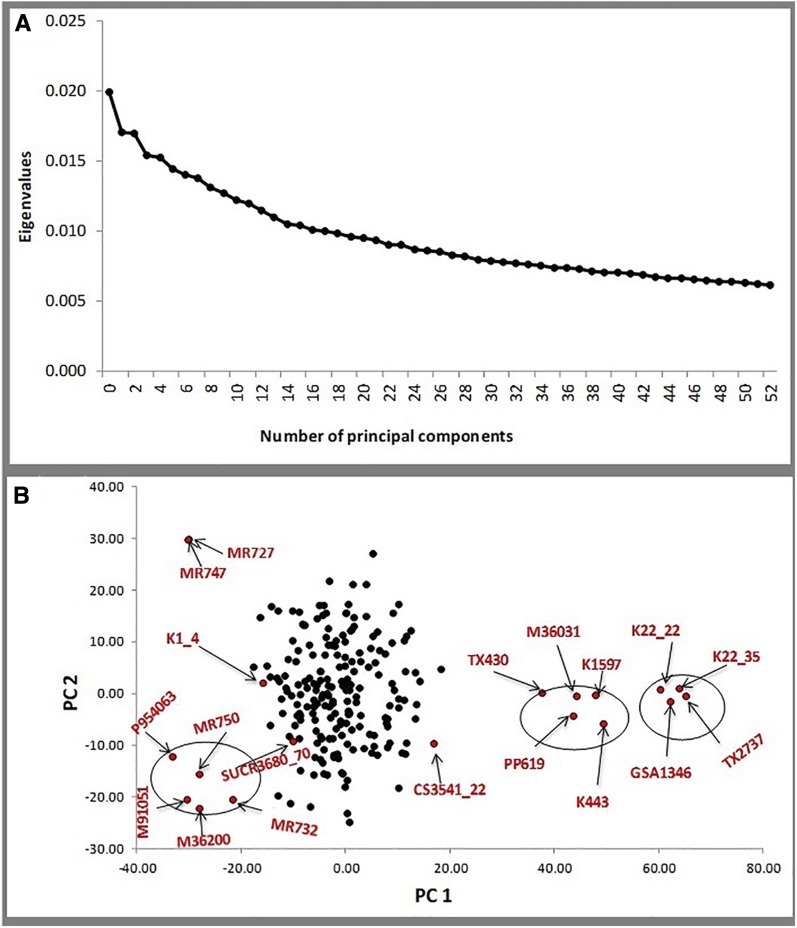
Figure 4.
PC analysis of the sorghum MAGIC population. (a) Scree plot of the PCs (x-axis) and their contribution to variance (the eigenvalues) y-axis). (b) Axes plot of the first two PCs for the MAGIC subset (black dots), including the founders (red dots labeled with founder names). The MAGIC subset appears to form a single group surrounded by three major clusters of founders (black circles around groups of red dots). chr, chromosome; MAGIC, multi-parent advanced generation intercross; PC, principal component.

