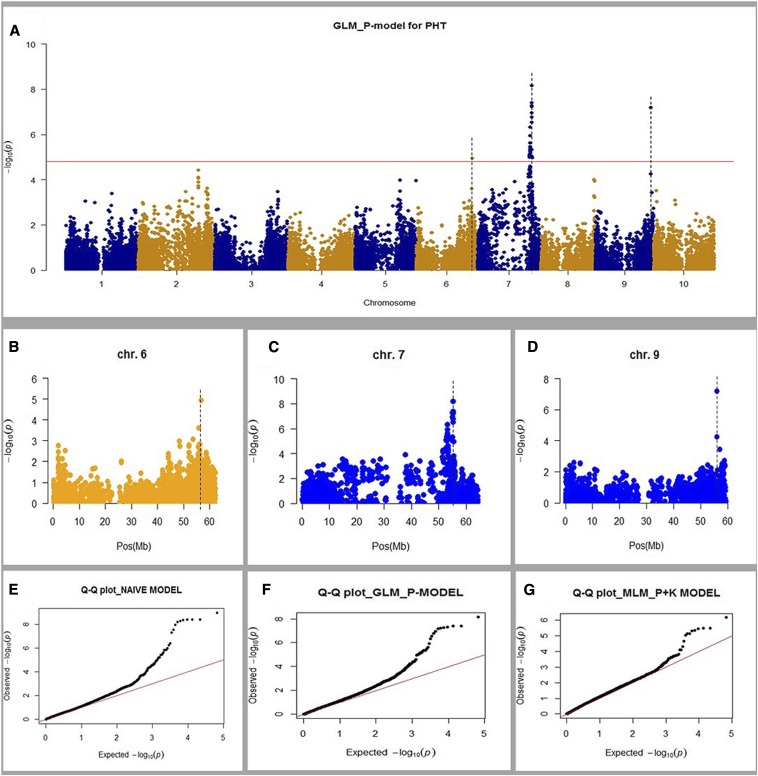
Figure 6.
Genome-wide scan for plant height loci. (a) Manhattan plot based on Q-model shows a strong association signal in the plant height gene regions. (b–d) Highlight of peaks for the two known (DWARF1 and DWARF3) and one new (QTL-6) dwarfing genes: (b) QTL-6, (c) DWARF3, and (d) DWARF1. The vertical dashed lines show the physical positions of the height genes. (e–g) Q-Q plots for the three models: (e) naïve model, (f) Q-model, and (g) Q+K-model. Significant threshold (horizontal line) in (a) was determined based on the average linkage disequilibrium (LD) decay extent in the multi-parent advanced generation intercross (MAGIC) population as: Number of independent tests = reference genome size (730 Mb)/MAGIC LD extent (220 kb); the threshold is then obtained as [0.05/(730 Mb/0.22 Mb)] = 1.50685 × 10⁻⁵, equivalent to −log10(P) of 4.8.

