Figure 6.
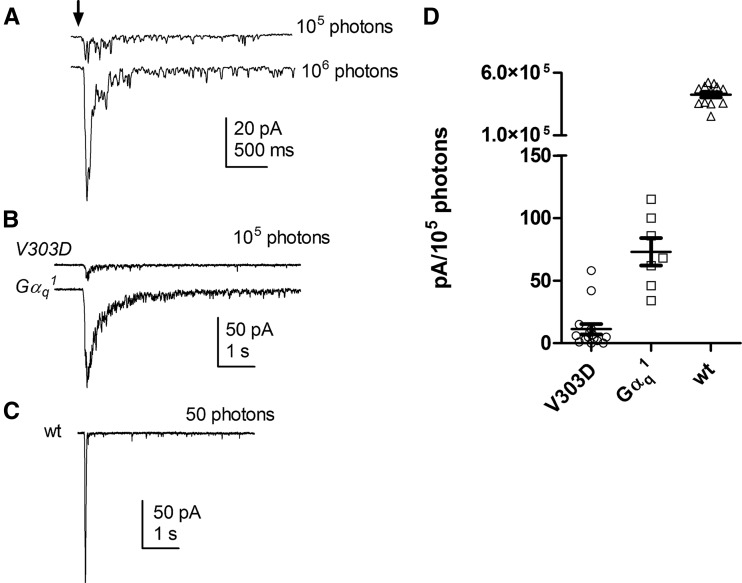
Light responses measured by whole-cell recording. (A) GαqV303D mutants display greatly reduced responses to 10 msec flashes containing ∼105 and 106 effective photons. (B) GαqV303D mutant’s response to 100 msec flashes containing 105 photons was greatly reduced when compared with that of Gαq1 mutants. (C) A wild-type response is shown. (D) Summary data of peak amplitudes in response to flashes containing 105 photons in wt (n = 11), GαqV303D (n = 15), and Gαq1 (n = 7) mutants. The complete genotypes are as follows: w1118 (wt); w1118; GαqV303D (V303D); w1118; Gαq1 (Gαq1).

