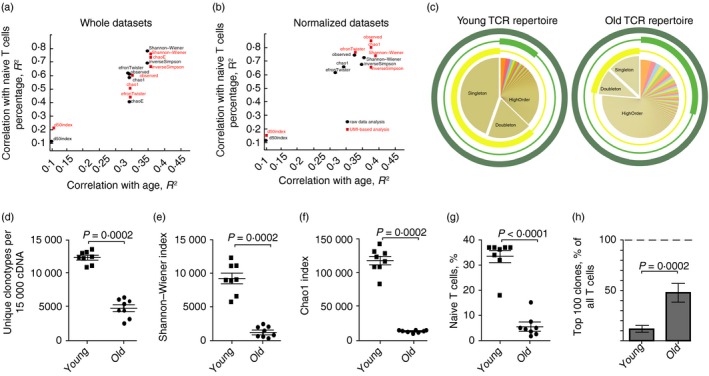
Figure 3.

Analysis of T‐cell receptor‐β (TCR‐β) CDR3 repertoire diversity in young and old mouse peripheral blood mononuclear cells (PBMC). (a, b) Spearman correlations for the diversity metrics and age or naive T cells percentage in the blood of young (n = 8) and old (n = 8) mice. Black circles correspond to the MiXCR data sets. Red squares correspond to the unique molecular identifiers (UMI)‐based analysis (MIGEC+MiXCR). Correlations are shown for the non‐normalized data sets: all obtained UMI or sequencing reads (a), and normalized data sets (down‐sampled to 15 000 sequencing reads or 15 000 UMI) (b). (c) Schematic representation of the TCR repertoire diversity assessment using different diversity metrics. Examples of a young (left) and an old (right) mouse peripheral blood TCR‐β CDR3 repertoire are shown. Three circles represent observed diversity (dark green), Shannon–Wiener index (light green), and Chao1 (yellow) metrics. Segment of the TCR repertoire that contributes mainly to a metric is shown by the bold part of the circle. Observed diversity takes into account all clonotypes, Chao1 depends mostly on the representation of singletons and doubletons (clonotypes represented by one and two reads, correspondingly).70 Shannon–Wiener index characterizes structural complexity of the TCR repertoire based on assessment of the evenness of distribution of relatively abundant clonotypes. (d–f) Diversity metrics for TCR‐β CDR3 repertoires in young and old mice. Data sets were normalized by down‐sampling to 15 000 randomly chosen UMI. Two‐tailed unpaired Mann–Whitney test showed that all diversity estimates were significantly different between old and young mice. (g) Percentage of naive T cells of all CD3+ T cells in peripheral blood of young and old mice. Each symbol represents an individual mouse; small horizontal line indicates the mean. Two‐tailed unpaired Mann–Whitney test was applied. (h) Share of the whole repertoire occupied by the top 100 most frequent clonotypes.
