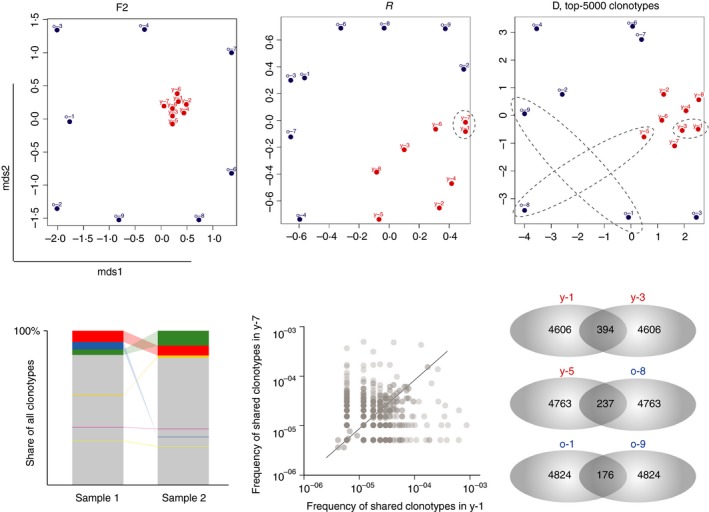
Figure 5.

Visualizing repertoire overlaps. Multi‐dimensional scaling (MDS) analysis of the T‐cell receptor‐β (TCR‐β) CDR3 repertoires in young (red circles, n = 8) and old (blue circles, n = 8) mouse peripheral blood (upper panels). Metrics F2, R and D show that young (red dots) data sets show a high similarity to each other, whereas the old ones demonstrate distinctive features of the TCR‐β repertoires, due to the decreasing proportion of naive T cells and expansion of different antigen‐experienced clones with age. For the D metric, cluster analysis was restricted to the top 5000 clonotypes per sample. Bottom panels show schematic (for the F2 metric) and exemplary (for R and D metrics) pairwise analyses of samples overlap.
