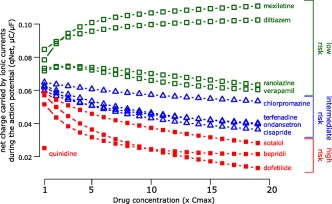
Figure 4.

In silico proarrhythmia risk categorization of the 12 CiPA training set drugs. Mechanistic proarrhythmic prediction from the in silico cardiomyocyte model indicating how close a drug is to generating an early afterdepolarization, the trigger for torsade de pointes. The X axis indicates drug concentration in multiples of clinical Cmax for each drug separately (e.g., 1‐fold Cmax, 2‐fold Cmax, etc., up to 19‐fold Cmax); Y axis is the proarrhythmic metric, which is defined as the area under the curve of the net current during an action potential (qNet, see text and Dutta et al.33). Drugs associated with different TdP risk categories are labeled and color‐coded as high risk (red solid squares), intermediate risk (blue triangles), and low risk (green empty squares) based on the clinical risk categorization in Supplementary Table S1. For quinidine, qNet is reported only for Cmax because simulations for higher concentrations caused early afterdepolarizations. Adapted from Dutta et al.33
