
Figure 3.
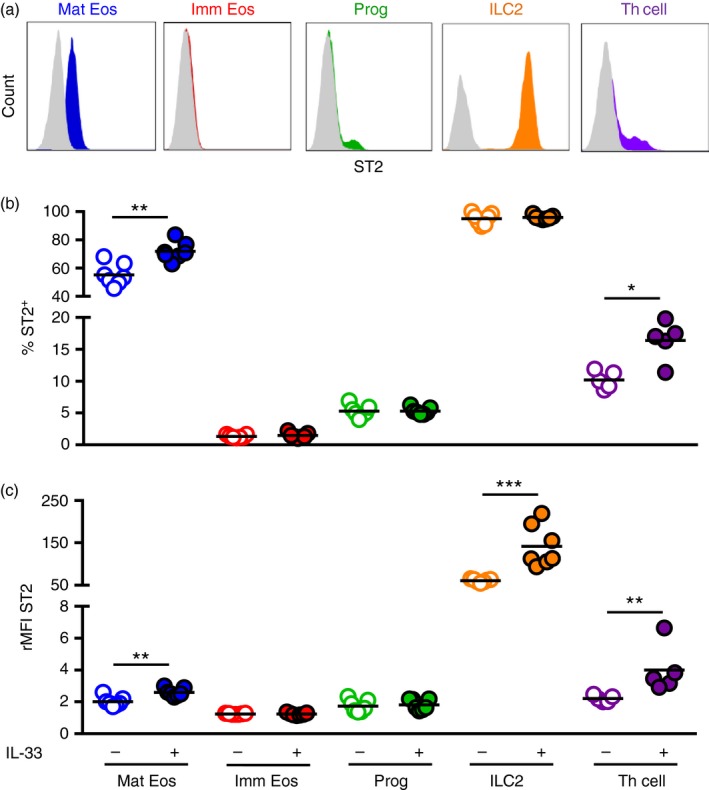
Mature eosinophils (Mat Eos), type 2 innate lymphoid cells (ILC2s) and T helper (Th) cells in bone marrow respond to IL‐33 through IL33R/ST2. (a) Representative IL‐33 receptor (ST2) expression on investigated bone marrow populations. Percentage ST2+ cells (b) and ST2 receptor density (rMFI) (c) within indicated populations in bone marrow from IL‐33‐treated or PBS‐treated mice. Data are shown as means (n = 5 to n = 7 per group). *P < 0·05, **P < 0·01, and ***P < 0·001. [Colour figure can be viewed at wileyonlinelibrary.com]