
Figure 4.
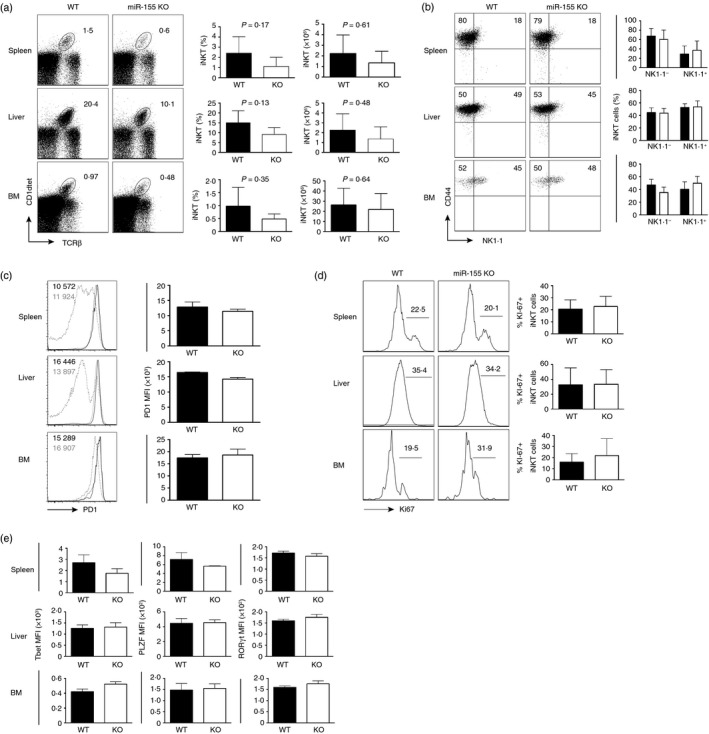
Loss of miR‐155 does not affect invariant natural killer T (iNKT) cells at 3 days after activation. (a) Flow cytometric analysis of iNKT cell frequency in the spleen, liver and bone marrow (BM) at 3 days post intraperitoneal injection with 2 μg α‐galactosylceramide (α‐GC). Bar graphs indicate iNKT cell frequency and absolute number (± SEM) in the indicated tissue. (b) Flow cytometric analysis of CD44+ and NK1.1+ expression by gated iNKT lymphocytes from the indicated genotype and tissue. Graphs indicate average frequency (± SEM) of NK1.1− CD44+ or NK1.1+ CD44+ CD1d‐tet+ TCR‐β + gated iNKT cells from the indicated genotype and tissue. (c) Flow cytometric analysis and median fluorescence intensity (MFI) of PD1 expression by gated iNKT lymphocytes from the indicated genotype and tissue. Black line indicates wild‐type (WT), grey line indicates miR‐155‐deficient (miR‐155 KO) and dotted line indicates conventional T‐cell control for comparison. (d) Histograms indicating Ki‐67 expression in iNKT cells from the indicated genotype and tissue at day 3 after activation. Graphs indicate average frequency (± SEM) of Ki‐67+ CD1d‐tet+ TCR‐β + gated iNKT cells from the indicated genotype and tissue. (e) Graphs showing TBET, PLZF and ROR γt MFI by gated iNKT cells from WT and miR‐155 KO mice after 3 days activation with α‐GC. Graphs are representative of four to six mice from two independent experiments.