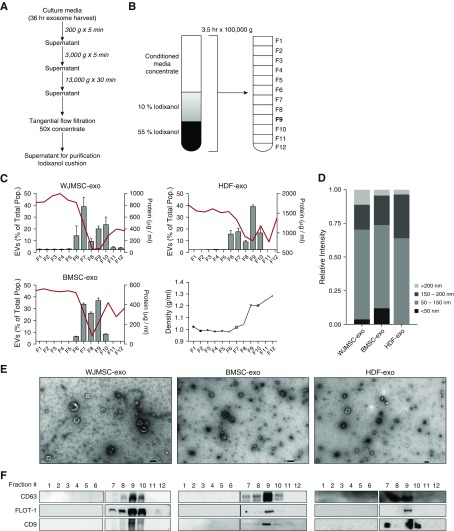
Figure 1.
Purification, isolation, and characterization of exosomes. Wharton’s jelly mesenchymal stem/stromal cells (WJMSCs), bone marrow MSCs (BMSCs), and human dermal fibroblasts (HDFs) secrete heterogeneous exosome populations. (A) To isolate exosomes, conditioned media (CM) were subjected to successive differential centrifugation followed by tangential flow filtration. (B) Concentrated (50×) CM was floated on an iodixanol (IDX) cushion gradient to purify and isolate the exosome population (fraction 9, density ∼1.18 g/ml). (C) Nanoparticle tracking analysis and protein concentration was used to assess exosome concentration and particle:protein ratio in the IDX cushion (12 × 1 ml fractions), respectively. The red line denotes protein concentration, and the bar charts reflect exosome concentration. Fraction density is expressed as grams per milliliter. Each symbol represents a fraction from the Opti-prep cushion gradient. Data are shown as mean ± SEM. (D) Representative size distribution of WJMSC exosomes (-exos), BMSC-exos, and HDF-exos isolated from their corresponding fraction 9 gradients. (E) Transmission electron microscopy images demonstrating heterogeneous vesicle morphology (high magnification, 30,000×; scale bars = 100 nm). (F) The IDX cushion gradient fractions were analyzed by Western blot (fraction 1–6 and 7–12, side by side), using antibodies to proteins representing exosome markers. Equivalent volume of each fraction was loaded per lane. Representative images are shown. As expected for exosome markers, flotillin (FLOT)-1 and tetraspanins (CD63, CD9) were enriched in fraction 9. EVs = extracellular vesicles.

