Figure 3.
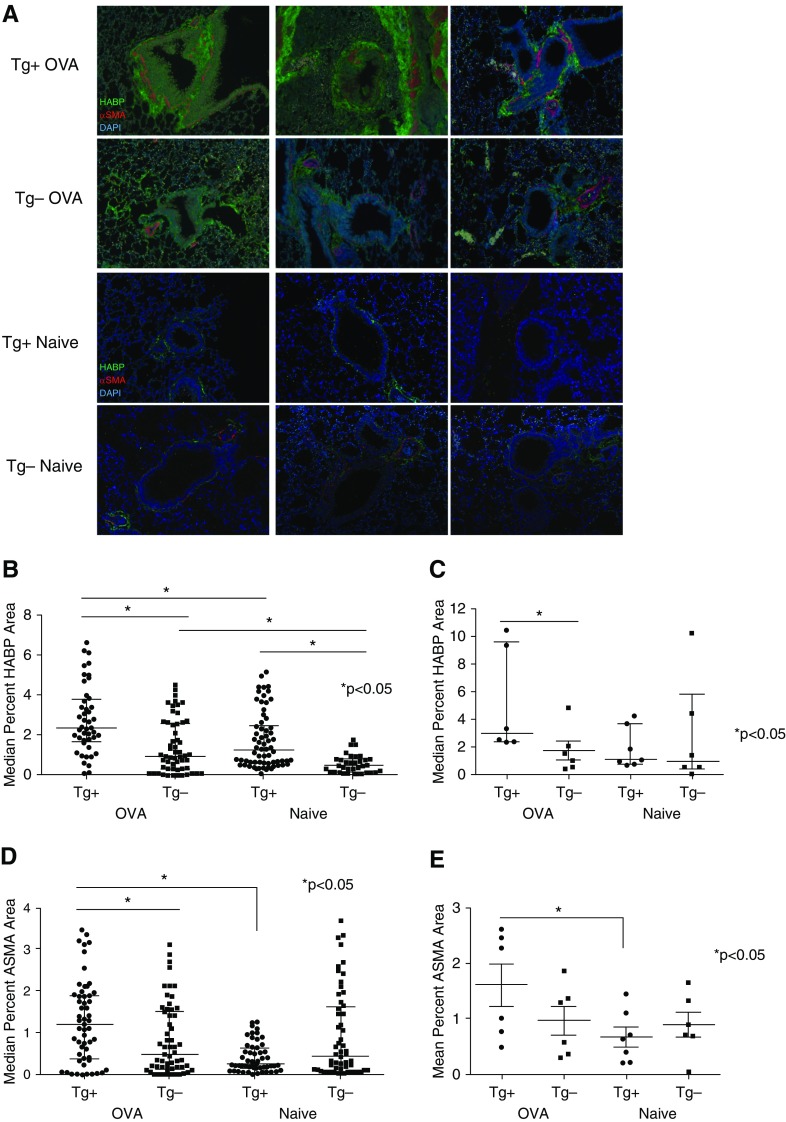
Immunofluorescence staining for HA-binding protein (HABP) and α-SMA in naive and OVA-challenged α-SMA−HAS2+ and α-SMA−HAS2− mice. (A) Representative ×100 images of airway sections from three different naive (Tg+ Naive) and OVA-challenged α-SMA−HAS2+ mice (Tg+ OVA) and three different naive (Tg− Naive) and OVA-challenged α-SMA−HAS2− mice (Tg− OVA). The airways were stained for HABP (green), α-SMA (red), or DAPI (blue). ImageJ was used to quantify the median percent of green HABP (B) or red α-SMA (D) peribronchial staining per total area in 10 airways per mouse. The median percent HABP (C) or mean percent α-SMA (E) peribronchial staining per mouse is depicted, with each point representing the mean percent staining area for an individual mouse. At baseline, peribronchial HABP staining in naive α-SMA−HAS2+ (n = 7) mice was significantly increased compared with staining in naive α-SMA−HAS2− mice (n = 6); *P < 0.05. Staining of both HABP and α-SMA surrounding the airways was significantly increased in OVA-challenged α-SMA−HAS2+ mice (n = 6) compared with OVA-challenged α-SMA−HAS2− mice (n = 6) and naive α-SMA−HAS2+ (n = 7) mice; *P < 0.05.

