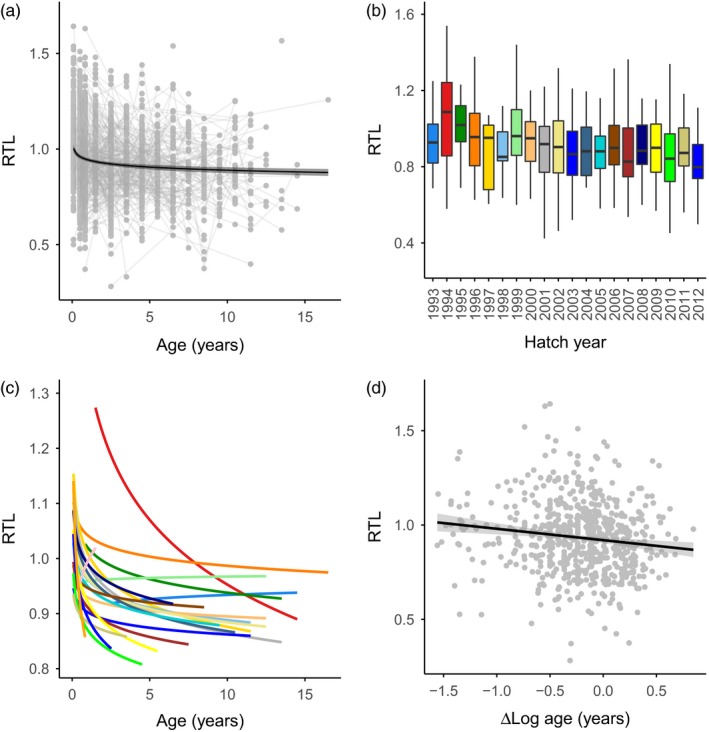
Figure 1.

Telomere dynamics in relation to age in Seychelles warbler cohorts. (a) Relative telomere length (RTL) and age across all individuals. Points and connecting thin grey lines represent individual samples and birds respectively. The thick line and shaded area represent the fitted values and 95% confidence limits of a linear regression of RTL and log‐transformed age. (b) Boxplot of variation in RTL among juvenile individuals from all cohorts. (c) RTL and age among cohorts. Lines represent fitted values from a linear regression of RTL and log‐transformed age, and colours correspond to b. (d) RTL in relation to and ∆Log age (i.e. within‐individual variation in log age)
