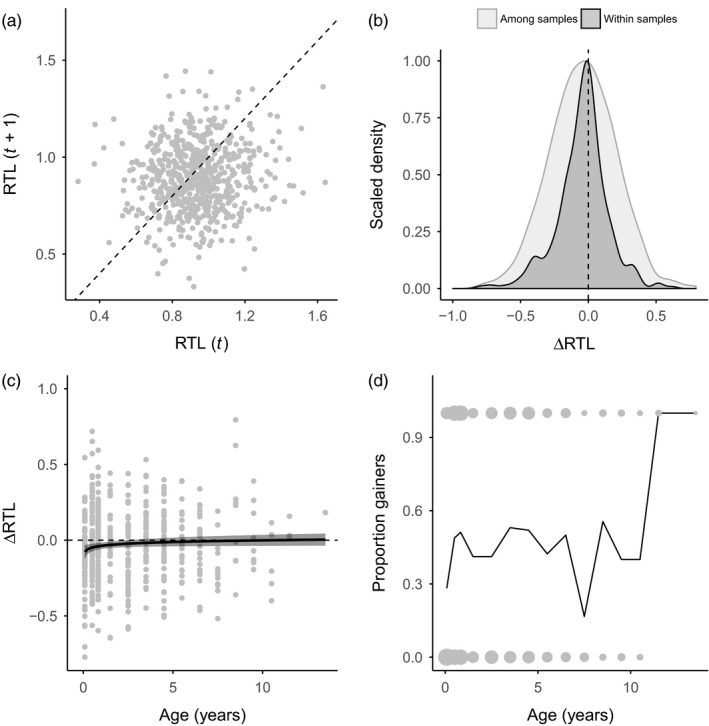
Figure 2.

Longitudinal telomere dynamics in the Seychelles warbler. (a) Variation in relative telomere length (RTL) within individuals sampled at different time points. The dotted line represents parity, and thus points above and below the line represent increases and decreases in RTL respectively. (b) Scaled density plots of repeated RTL measurements among individual samples, and among different samples taken from the same individual. Areas of the density plot to the left of the dotted line represent decreases in RTL, while areas to the right represent increases. (c) ∆RTL in relation to age in pairs of samples taken within 2 years. Black line and shaded area represent fitted values and 95% confidence limits from a linear regression of RTL and log‐transformed age. (d) Probability of telomere lengthening occurring in relation to age. Points at zero and one represent pairs of samples where RTL has decreased and increased, respectively, with point size scaled by the number of overlapping values. The black line represents the proportion of samples in which increases in RTL where observed at each age category
