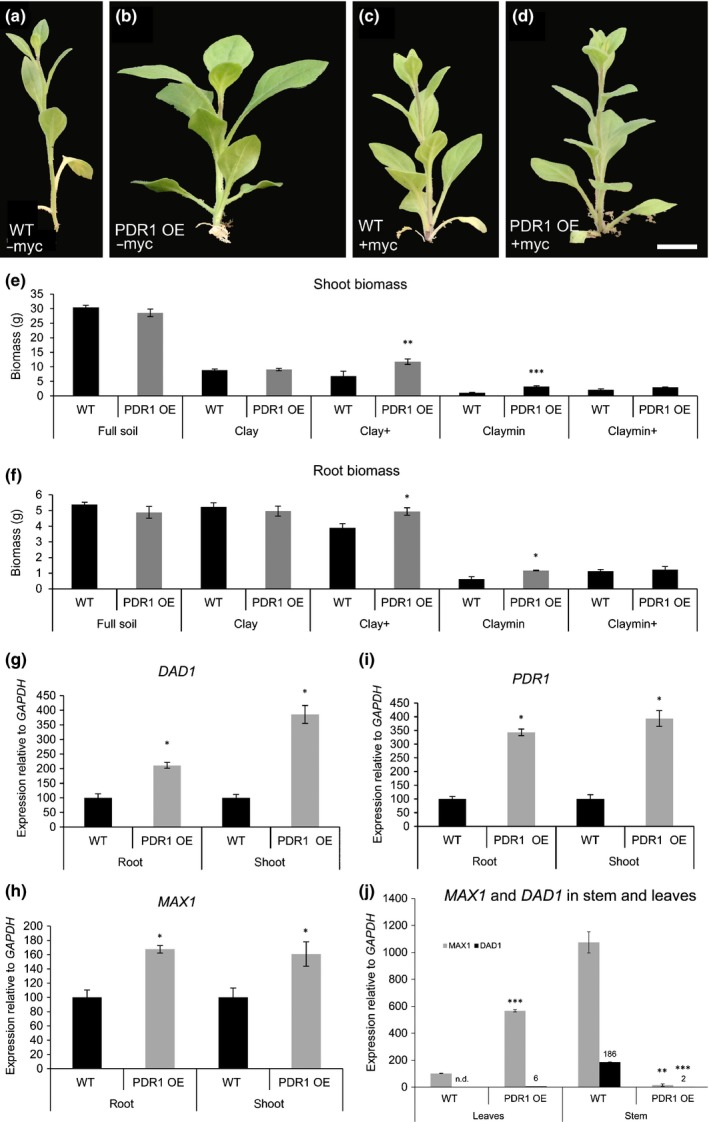
Figure 4.

Biomass and gene expression levels in roots and shoots of wild‐type (W115 (WT)) and PDR1 OE Petunia hybrida plants. (a–d) Shoots of W115 and PDR1 OE on Claymin +/– mycorrhizal fungi. (e, f) Shoot and root biomasses in WT and PDR1 OE plants. (g, h) DAD1 and MAX1 expression levels in 6‐wk‐old PDR1 OE roots and shoots. (i) PDR1 expression levels in 6‐wk‐old PDR1 OE plants. (j) MAX1 and DAD1 in stems and leaves of WT and PDR1 OE plants. Bars, 2 cm. Values are means ± SE. *, P < 0.05; **, P < 0.005; ***, P < 0.0005.
