
Figure 1.
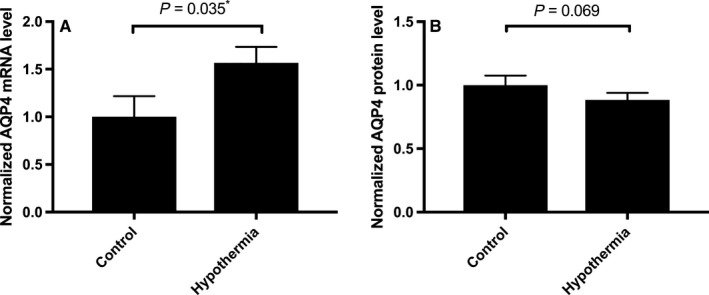
AQP4 mRNA and protein expression levels in cultured primary human astrocytes. Data are mean fold changes in expression (±SEM) of cells incubated at 32 °C for 4 h (labelled ‘Hypothermia’) compared with normothermic (‘Control’) astrocytes. Each bar represents the mean ± SEM for each of the conditions. Kruskal–Wallis with Conover–Inman post hoc analysis tests were used to identify significant differences between samples. *Represents statistical significance (P < 0.05). Panel (A) shows RT‐qPCR data (N = 5) using Taqman probes and analysis normalized to the two housekeeping genes, PPIA and CDKN1B. Panel (B) shows sandwich ELISA data (N = 4).