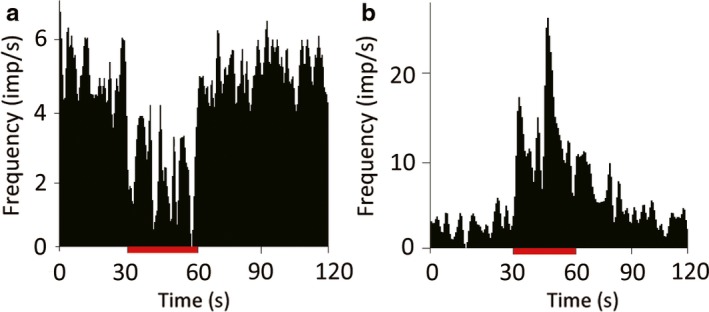
Figure 4.

Response variability of TANs to GPi‐HFS. Most TANs showed an 89% decrease in activity to GPi‐HFS (a), but a minority (5%) were excited (b) (P < 0.05, Mann–Whitney U‐test). Red bar indicates the stimulation period (30 s). [Colour figure can be viewed at wileyonlinelibrary.com].
