Figure 3.

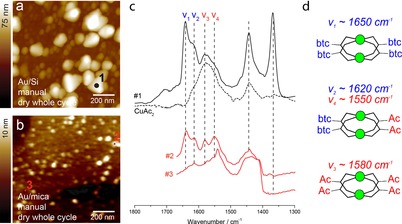
AFM images and AFM‐nano‐IR spectra recorded on Au/Si and Au/mica HKUST‐1 SURMOF thin films. a) AFM image of a thin film on Au/Si measured after 5 deposition cycles using manual synthesis with drying each whole cycle. b) AFM image of a thin film on Au/mica measured after 2 deposition cycles grown in the same way as (a). c) Representative nano‐IR spectra recorded at different positions for the substrates presented in (a,b). Spectrum (#1) is taken on top of a large SURMOF grain (1 black), spectra #2 and #3 are taken at two different positions. An IRRAS spectrum of CuAc2 (dotted line) is added for comparison. d) Vibrational modes assigned to COO− originating from the different Cu‐paddle‐wheel substitutions. Note that models are simplified for clarity by omitting C and O atoms coordinated to copper; copper atoms are depicted in green.
