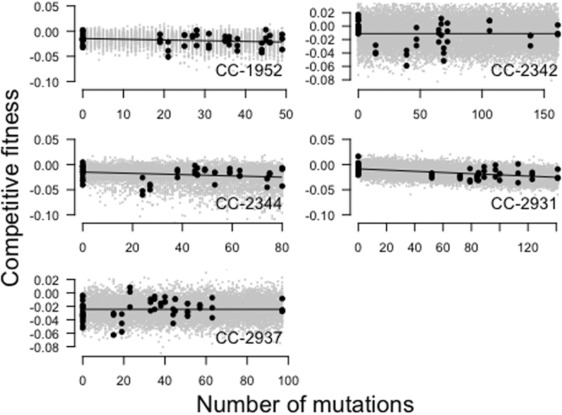
Figure 3.

Competitive fitness plotted against the total number of mutations in the five genetic backgrounds. Black dots represent observed fitness values, gray dots represent predicted fitness values based on the frequencies of mutational effect categories derived from the best‐fitting model of mutational effect categories (Table 3). Black lines indicate a linear model fit of the observed data.
