Figure 2.

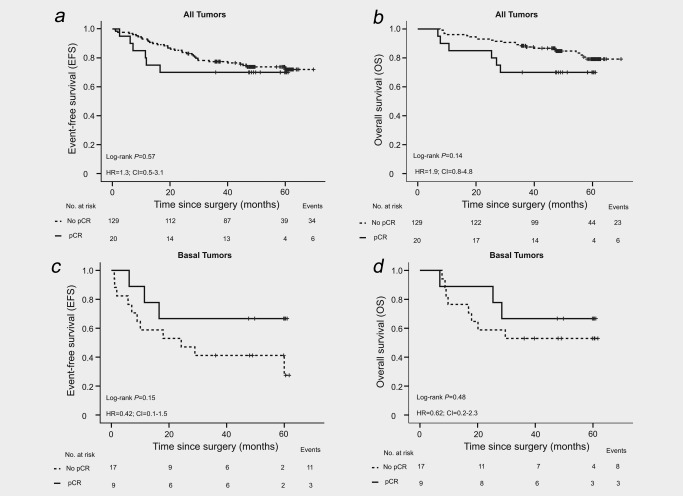
Kaplan–Meier survival analyses. (a) EFS and (b) OS for all patients in the trial (N = 149). (c) EFS and (d) OS for patients with basal tumors (N = 26).

Kaplan–Meier survival analyses. (a) EFS and (b) OS for all patients in the trial (N = 149). (c) EFS and (d) OS for patients with basal tumors (N = 26).