
Figure 3.
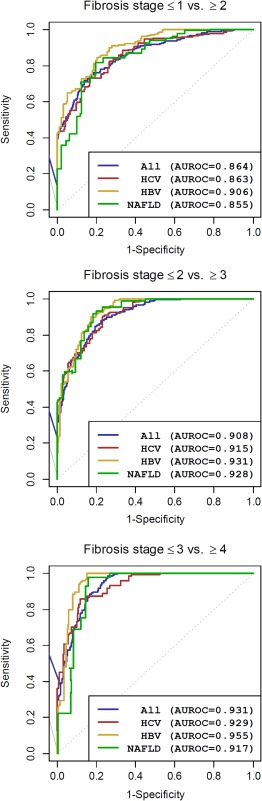
Summarized ROC curves and diagnostic performance by AUROC estimated using a random effect approach for all patients and for HCV, HBV, and NAFLD patients.
Official websites use .gov
A
.gov website belongs to an official
government organization in the United States.
Secure .gov websites use HTTPS
A lock (
) or https:// means you've safely
connected to the .gov website. Share sensitive
information only on official, secure websites.
Summarized ROC curves and diagnostic performance by AUROC estimated using a random effect approach for all patients and for HCV, HBV, and NAFLD patients.