
Figure 1.
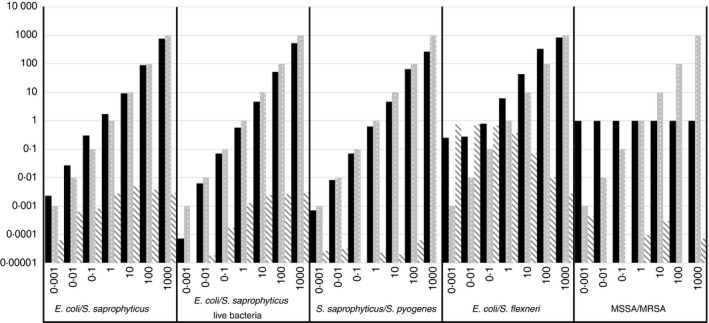
16S rRNA gene sequencing sensitivity and accuracy. Expected (grey bars) versus observed (black bars) ratios for binary mixtures of DNA and live bacteria ranging from 0·1 to 99·9% for each organism are graphed. Error ratio (striped bars), total count of species identified that were not added to the mixture divided by total number of reads. ■ Observed ratio;  Expected ratio;
  Error ratio.