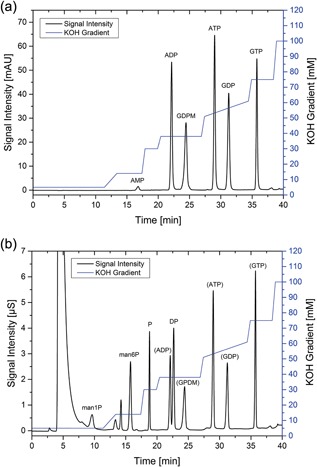
Figure 2.

(a) UV‐Chromatogram of a 170 µM standard sample for the developed and optimized elution (KOH) gradient. The UV wavelength for detection was 260 nm. ADP, GDP‐mannose, ATP, GDP, and GTP concentrations were quantified by UV signals. The assay was validated. (b) Conductivity chromatogram of a 170 µM standard sample for the developed and optimized elution (KOH) gradient. Suppression of hydroxide ions was conducted by the electronically regenerated suppressor ERS500 from Dionex. The large peak at 5 min was caused by Cl− ions. Man1P, man6P, phosphate (P), and diphosphate (DP) concentrations were measured by conductivity detection. The assay was validated
