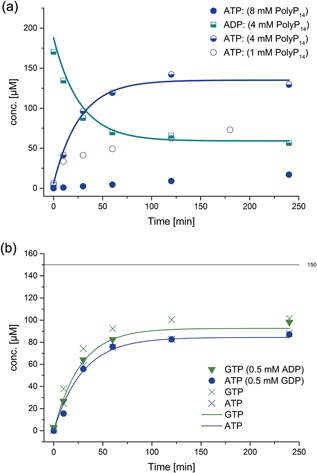
Figure 5.

(a) Phosphorylation of ADP and GDP by His6‐1D‐Ppk2 (0.05 mg/ml): ATP concentration profile (ADP, GDP, and GTP not shown) with various initial PolyP14 concentrations. Starting concentrations were 0.2 mM ADP, 0.2 mM GDP, and various PolyP14 conc. (see legend). The lines represent the model based on mass action kinetics. It was not possible to obtain a simple kinetic rate law to model the reaction inhibition of high and low concentrations of PolyP14. (b) The phosphorylation reactions of ADP and GDP are independent of each other at the investigated conditions. Starting concentrations: Blue cross: 0.15 mM ADP versus blue circles: 0.15 mM ADP, 0.5 mM GDP; green cross: 0.15 mM GDP versus green triangles: 0.15 mM GDP, 0.5 mM ADP. The lines represent the concentrations of GTP (green) and ATP (blue) obtained from simulations. 150 µM is the highest possible GTP and ATP conc., respectively, according to the mass balance. The fits depicted are fits to the entire data set of His6‐1D‐Ppk2 catalyzed reactions
