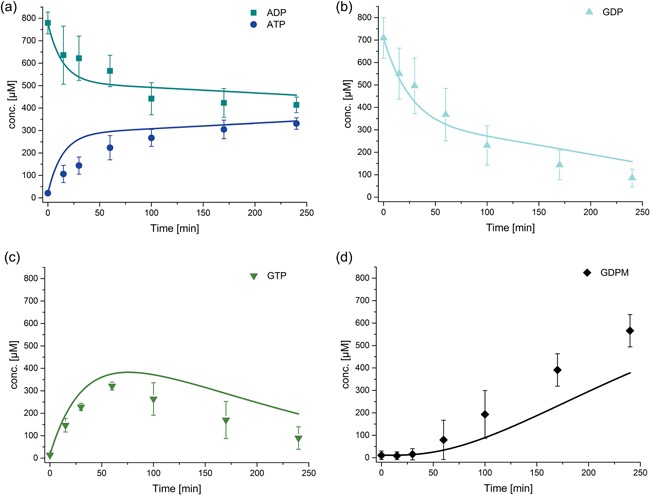
Figure 6.

Cascade reaction for the production of GDP‐mannose starting from mannose, ADP, GDP, and PolyP14–experimental (dots) and simulated data (lines). Enzyme concentrations are His6‐Glk 0.5 mg/ml, His6‐1DPpk2 0.05 mg/ml, ManB‐His6/ManC 0.3 mg/ml, and PmPpA‐His6 0.1 mg/ml and initial concentrations ADP 0.8 mM, GDP 0.8 mM, mannose 6 mM, and PolyP14 4 mM. Reaction conditions: pH 7.5, 30°C and 10 mM MgCl2. The error bars represent the standard deviation of the mean calculated from four replicates. The fits depicted are fits to the entire data set of ManB‐His6/ManC catalyzed reactions. (a) ADP and ATP concentrations, (b) GDP concentration, (c) GTP concentration, (d) GDP‐man concentration
