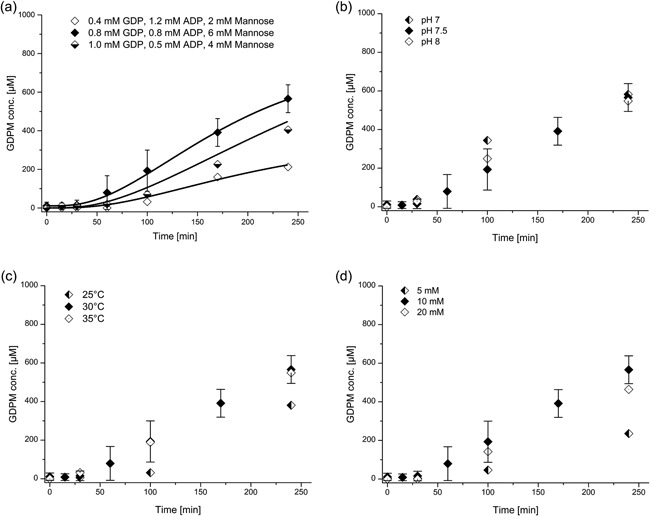
Figure 7.

GDP‐mannose concentration over time for cascade reaction starting from mannose, ADP, GDP, and PolyP14. Enzyme concentrations were His6‐Glk 0.5 mg/ml, His6‐1D‐Ppk2 0.05 mg/ml, ManB‐His6/ManC 0.3 mg/ml, and PmPpA‐His6 0.1 mg/ml. Initial substrate concentrations are ADP 0.8 mM, GDP 0.8 mM, mannose 6 mM, and PolyP14 4 mM; reaction conditions were pH 7.5, 30°C and 10 mM MgCl2 unless stated otherwise. The error bars of the standard reaction represent the standard deviation of the mean calculated from four replicates. (a) Experimental data (dots) and modeled data with k4,opt (lines) for various initial concentrations; (b) GDP‐mannose concentration for reactions at pH values 7.0, 7.5, and 8.0; (c) GDPmannose concentration for reactions at 25, 30, and 35°C; (d) GDP‐mannose concentrations for MgCl2 concentrations of 5, 10, and 20 mM. The fits depicted are fits to the entire data set of multi‐enzyme catalyzed reactions
