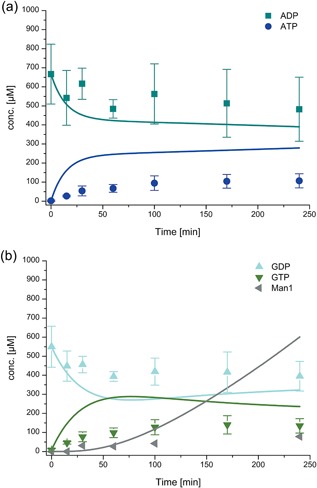
Figure 9.

GDP‐mannose cascade coupled to Alg1ΔTM to produce phytanyl‐PP‐(GlcNAc)2‐Man1 (Man1) with continuous regeneration of GDP‐mannose. Experimental data (dots) and simulated data (lines). Reaction conditions as in Figure 7 plus 0.1 mg/ml Alg1ΔTM and 0.7 mM phytanyl‐PP‐(GlcNAc)2. Man1 concentrations are estimated from normalized relative peak areas of (GlcNAc)2 and Man1. The error bars represent the standard deviation of the mean calculated from three replicates. (a) ADP and ATP concentrations, (b) GDP, GTP, and Man1 concentrations
