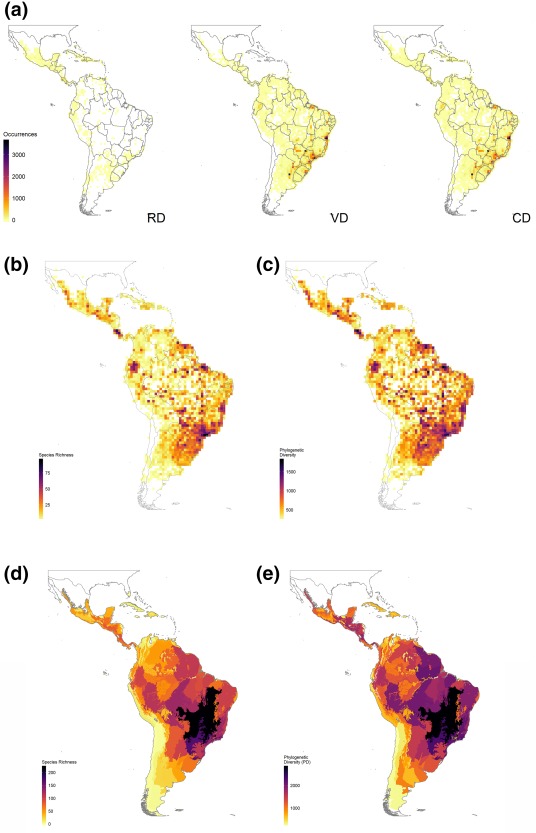
Figure 2.

Species occurrence data and spatial patterns of Neotropical snake diversity. (a) Geographical coverage of sampling of snakes measured in 1° × 1° grid cells. RD = raw dataset, obtained from www.gbif.org; VD = verified dataset, presented here; CD = combined dataset, produced by merging RD and VD. (b) Species richness at grid cells. (c) Phylogenetic diversity at grid cells. (d) Species richness at the ecoregion scale. (e) Phylogenetic diversity at the ecoregion scale
