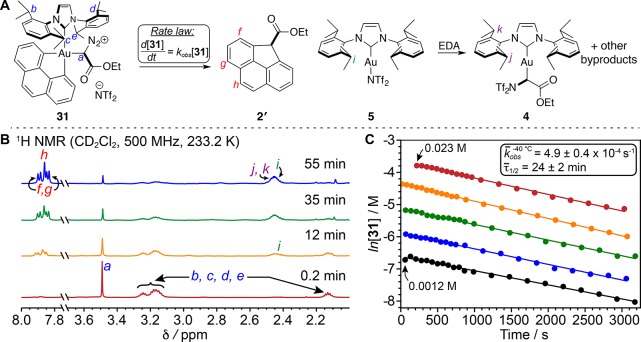
Figure 5.
(A) Transformation monitored by 1H NMR spectroscopy. (B) 1H NMR spectra, which illustrate the concurrent consumption of 31 and formation of 2′ and 5 and, later, 4 at 233.2 K. (C) Linearized plots of VT NMR kinetics data at various initial concentrations of 31 utilized to quantify kobs and τ1/2.

