Figure 1.
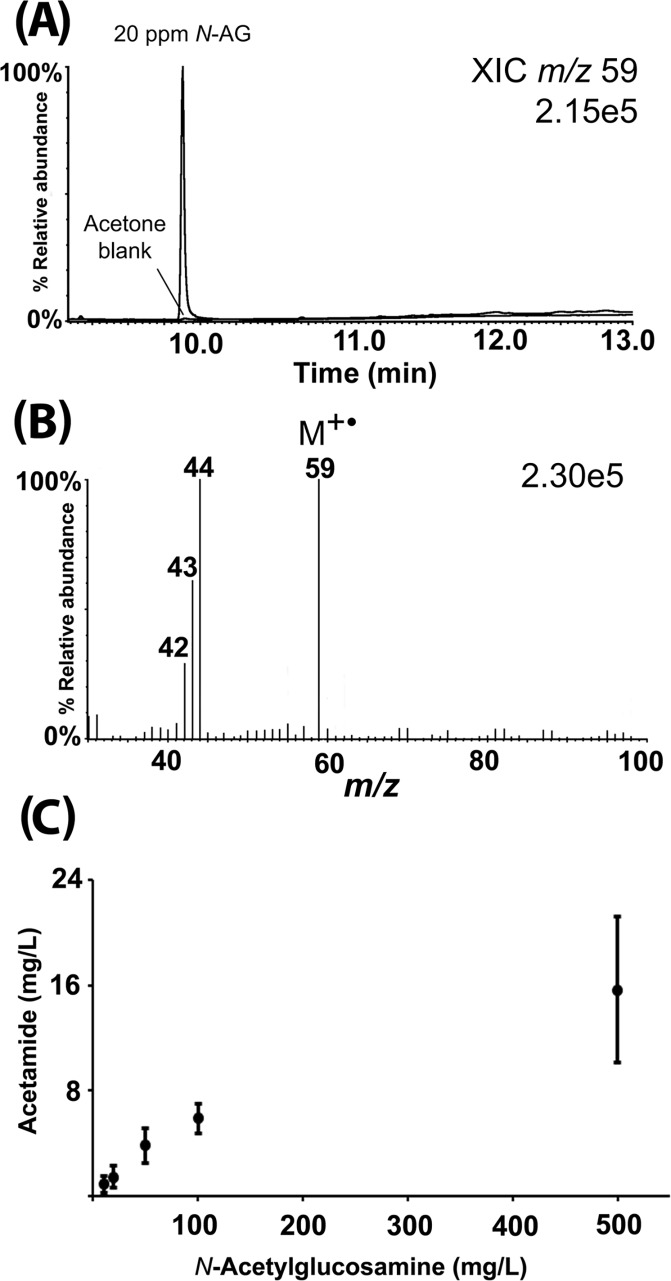
Illustration of artifactual formation of acetamide from N-acetylglucosamine during GC/MS analysis. (A) Appearance of an acetamide peak in the chromatogram when a 20 ppm standard solution of N-acetylglucosamine was injected directly into the heated injector of the GC/MS. The acetone blank is shown for comparison. (B) EI mass spectrum of the peak from panel A, confirming that the peak is acetamide. (C) Amount of acetamide generated via thermal degradation when N-acetylglucosamine is injected into a heated injector of the GC/MS at 10, 20, 50, 100, and 500 ppm. Error bars show standard deviations for three separate samples prepared at the same concentrations.

