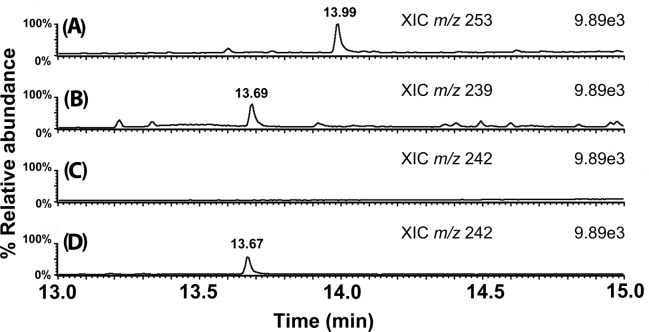
Figure 5.
Example GC/MS extracted ion chromatograms from a derivatized market beef (sirloin) sample. (A) Chromatogram showing the peak of internal standard; xanthyl-propionamide (m/z 253); (B) chromatogram showing the peak for xanthyl-acetamide (m/z 239); (C) chromatogram showing the peak for xanthyl-d3-acetamide (m/z 242); and (D) chromatogram showing xanthyl-d3-acetamide in the same market beef sample spiked with 250 ppb d3-acetamide before derivatization with 9-xanthydrol. All peaks are normalized to the highest ion count (internal standard) to facilitate comparison.

