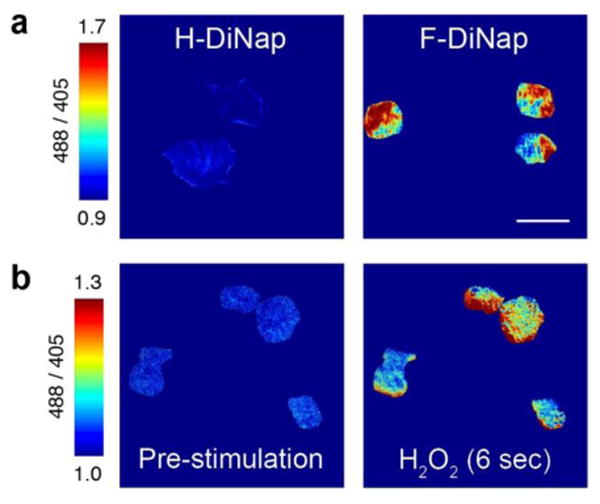
Fig. 3.

Live cell excitation ratiometric imaging of sulfenic acids in CH27 B-cells with DiNap probes. (a) Images were acquired by TIRF microscopy 15 minutes after probe addition, showing spatially resolved ratio changes with F-DiNap. The ratios were calculated after background subtraction of regions outside of cells, and dividing the emission intensities from each separate excitation. Scale bars are displayed to highlight scale and range of ratios displayed. (b) Hydrogen peroxide (1 mM) induces rapid F-DiNap ratio changes within a few seconds. Data is normalized to excitation ratios measured after 9 minutes of probe labeling. Images are representative of 3 biological replicates. Scale bar = 20 μm.
