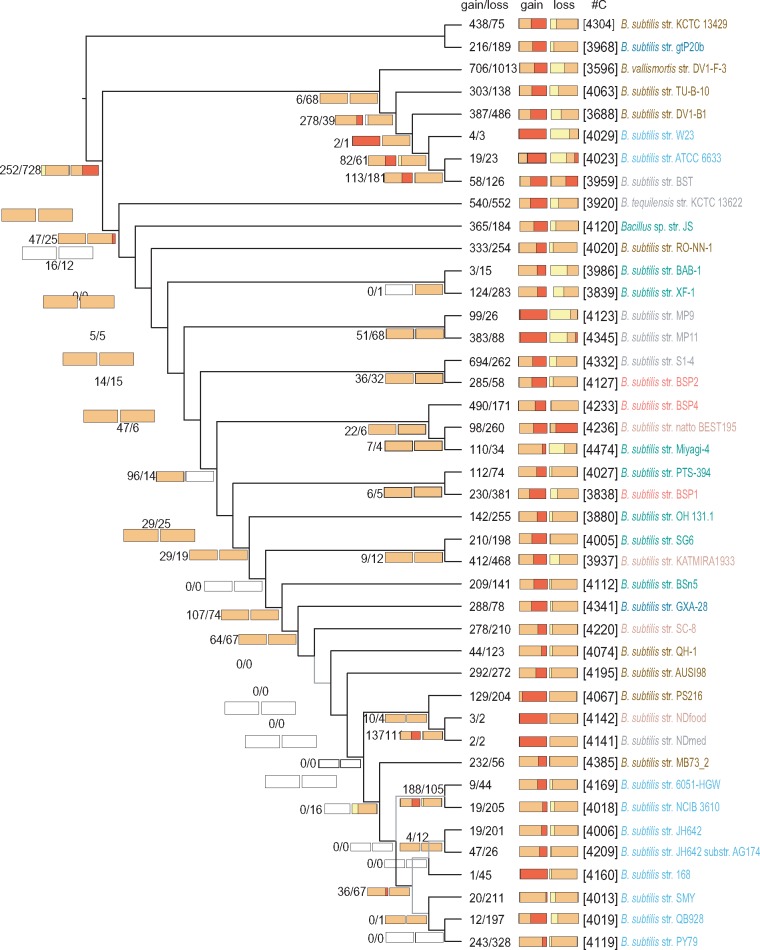
Fig. 3.
—B. subtilis genome dynamics. Estimated events of genome content evolution are mapped onto the genealogy estimated with the core genome (here shown without branch lengths for clarity). Numbers below the branches and at terminal nodes represent the estimated numbers of gene gain and loss events (gain/loss). The two horizontal bars are stacked histograms that represent the relative proportions of softcore (yellow), shell (orange) and cloud (red) gene gain and loss dynamics inferred for each node. Numbers in squared brackets (#C) are the total numbers of gene clusters per genome. Light gray branches indicate phylogenetic relationships with bootstrap support lower than 80% (see fig. 1).

