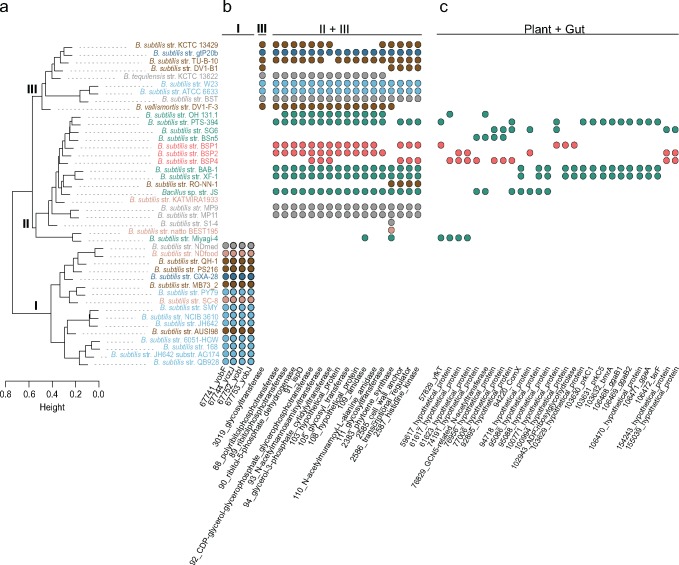
Fig. 5.
—Hierarchical cluster analysis of B. subtilis pangenome diversity and niche-specific genome content. (A) Dendrogram of the pairwise distances estimated with protein genome content; colors indicate niche at the site of sampling as in figure 1. Roman numbers on the nodes indicate the three major clusters of diversity; I and II include genomes of B. s. subtilis, and cluster III contains genomes from all other B. subtilis subspecies. On the right are phylogenetic profiles for selected gene clusters. In (B) are gene clusters distributed exclusively to clusters I, III, and II + III. Cluster II is more heterogeneous than the other clusters, and we found no gene with a distribution exclusive to this group of strains. In (C) are gene clusters identified only among genomes of strains sampled in plants or in the gut. These are putative examples of LGT associated with niche occupancy.

