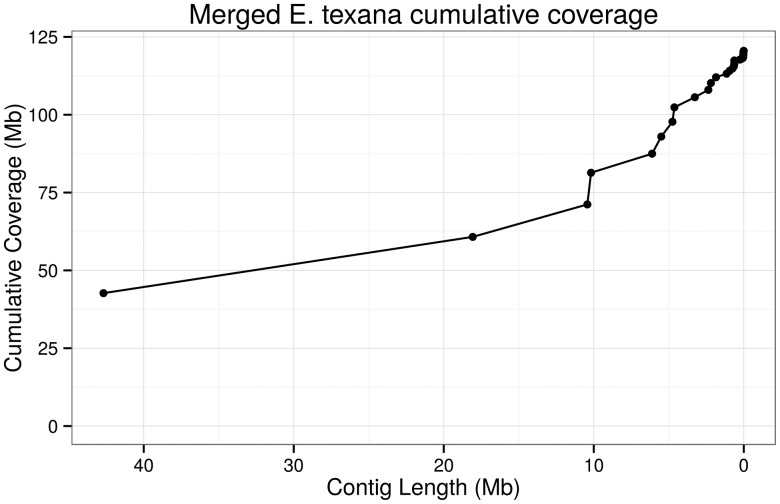
Fig. 3.
—A plot of cumulative genome coverage of the E. texana genome assembly by contig. As the plot progresses from left to right, the contig lengths are added to the cumulative coverage in order from largest to smallest. A high-quality assembly should achieve a high cumulative coverage with a small number of contigs. Here ∼80% of the assembly is contained in contigs larger than ∼5 Mb.

