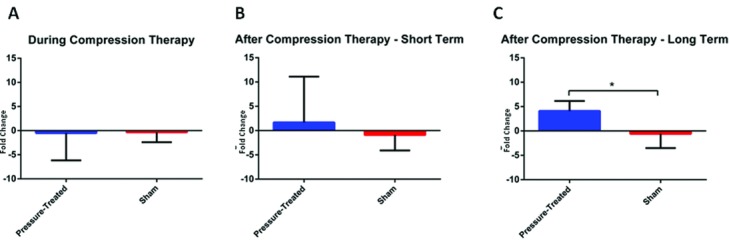
Figure 5.

MMP7 confirmatory real-time RT-PCR showing transcript levels of MMP7 during the application of compression (a) and changes in these levels in the short term after compression therapy (b) and in the long term after compression therapy (c). Error bars represent standard deviations of the mean. *Denotes significant difference (P < .05). RT-PCR indicates reverse transcription-polymerase chain reaction.
