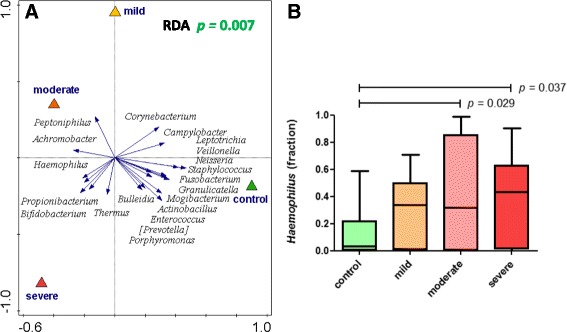
Fig. 6.

Nasopharyngeal microbiota composition allows for separation of healthy and RSV-infected individuals. Nasopharyngeal genus-level microbiota from healthy and RSV-infected individuals are significantly different (a). The figure shows a redundancy analysis (RDA) biplot. Triangles are the centroids of the study sample groups: mild (yellow), moderate (orange), and severe (red) RSV and healthy control (green). The blue arrows are the 20 best-fitting bacterial genera (names in italic), i.e., taxa that best explain the differences between the sample groups. The horizontal axis maximizes the variation in sample groups (in contrast to a principal component analysis plot, where the variation between individual samples is maximized). In RDA, samples (also) separated in the vertical direction indicate that this separation is (also) driven by other factors than the primary contrast, such as by individuality. The difference in microbiota is significant (according to a permutation test; p = 0.007). We observe a strong and significant overrepresentation of Haemophilus genus in RSV (p = 0.011; MWU, FDR-corrected) especially in moderate and severe RSV infections (b) and of Achromobacter (p = 0.001) (Additional file 2: Figure S4A)
