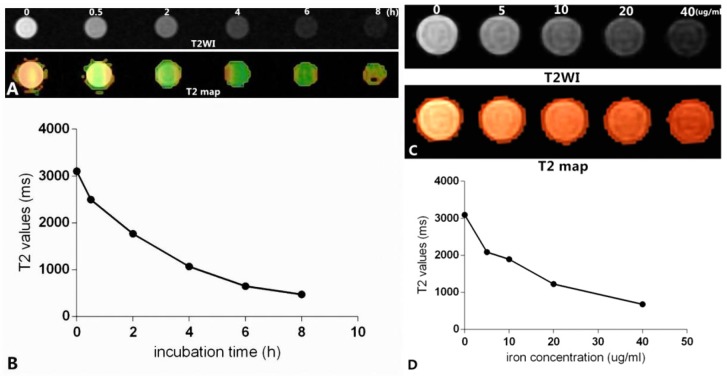
Figure 12.
In vitro MR images. (A) shows that Raw264.7 cells were inoculated with culture medium containing mPEG-Lys3-CA4- NR/SPION micelles with an Fe3+ concentrations of 40 µg/mL for 0, 0.5 h, 2 h, 4 h, 6 h, 8 h (T2WI and T2 map); (C) shows Raw264.7 cells inoculated with culture medium containing mPEG-Lys3-CA4-NR/SPION micelles with different Fe3+ concentrations of 0, 5, 10, 20, and 40 µg/mL for 6 h (T2WI and T2 map); (B)and (D) show the linear graph.

