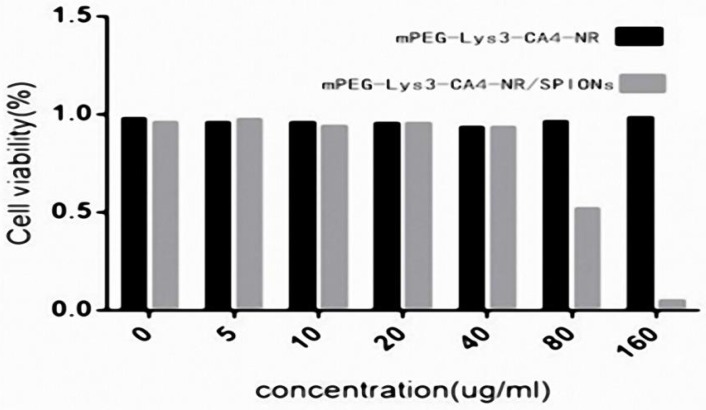
Figure 8.
Cell viability of micelles in Raw264.7 cells as determined by the MTT assay after cells were incubated for 36 h (n=3) with a series of concentrations of mPEG-Lys3-CA4- NR/SPION micelles and mPEG-Lys3-CA4-NR micelles, and the final concentration of iron of mPEG-Lys3-CA4- NR/SPION micelleswas 0, 5, 10, 20, 40, 80, 160 µg/mL (the mPEG-Lys3-CA4- NR/SPION micelle and mPEG-Lys3-CA4-NR micelle concentrations were both 0, 108.8, 217.5, 435, 870, 1740, 3480 µg/mL. To highlight the iron, the X-axis in this figure indicated the iron concentration). Notes: The data are represented as the means ± standard deviations from 4 experiments; P<0.05

